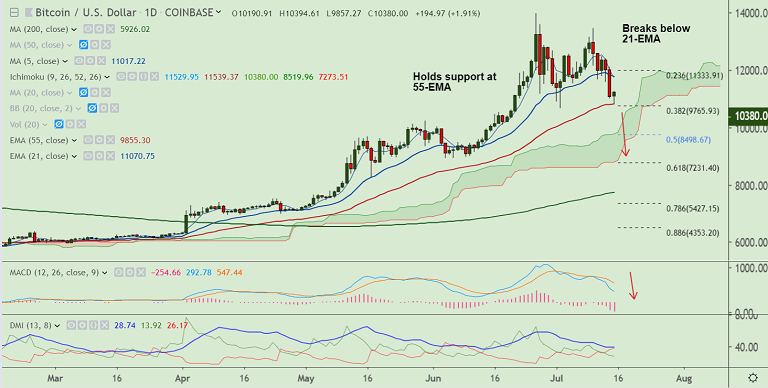
BTC/USD chart - Trading View
Exchange - Coinbase
Support: 9854 (55-EMA); Resistance: 11071 (21-EMA)
Technical Analysis: Bias Bearish
BTC/USD has edged higher from 13-day lows at 9857 and is currently trading at 10376 at 10:00 GMT.
The pair is showing scope for a potential 'hammer' formation on the daily charts raising scope for upside.
That said, price action has slipped below strong support at 21-EMA and technical indicators have turned bearish.
5-DMA is sharply lower and volatility is rising. Stochs and RSI are biased lower and RSI is well below 50, indicating strength in current downtrend.
Break below 55-EMA will see further weakness. Dip till 110-EMA at 8338 and then cloud top at 8519 likely.
Break below cloud will see further downside. Retrace above 21-EMA negates near-term bearish bias.
For details on FxWirePro's Currency Strength Index, visit http://www.fxwirepro.com/currencyindex.


Comment 0