 News
News  Coin Information
  About us
  Customer Service


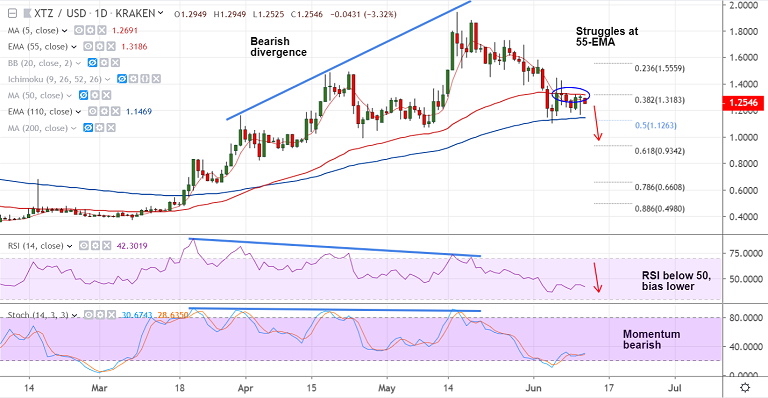
XTZ/USD chart - Trading View
Exchange - Kraken
Support: 1.1470 (110-EMA); Resistance: 1.3187 (55-EMA)
Technical Analysis: Bias Slightly Bearish
XTZ/USD pauses 3 straight weeks of losses, is extending sideways grind.
The pair is struggling to extend recovery, finds stiff resistance at 55-EMA (1.3187).
Technical studies support downside. MACD and DMI show further weakness.
Stochs and RSI are sharply lower and 'Bearish Divergence' on RSI and Stochs adds to the bearish bias.
'Hammer' at lows hampers downside, signals buying pressure at lows. Break below 110-EMA (1.1470) opens up short-term downside.
Next bear target lies at 61.8% Fib at 0.9342. Retrace above 55-EMA to negate near-term bearishness.
For details on FxWirePro's Currency Strength Index, visit http://www.fxwirepro.com/currencyindex.


Comment 0