 News
News  Coin Information
  About us
  Customer Service


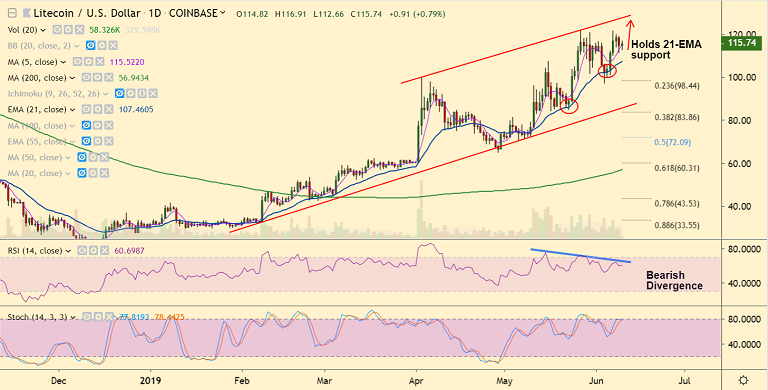
LTC/USD chart - Trading View
Exchange - Coinbase
Support: 107.45 (21-EMA); Resistance: 127 (trendline)
Technical Analysis: Bias Bullish
LTC/USD has resumed upside after a brief pause on June 9th trade, bias remains bullish.
The pair is extending consolidation above 21-EMA and we see weakness only on break below.
Pullback has held above 200H SMA and 5-DMA is still sharply higher.
'Cup and Handle' pattern seen on the daily charts. Price extends gains in accordance.
The pair is extending higher in a 'Rising Channel' pattern, scope for test of channel top at 127.
Back-to-back 'Spinning Top' and 'Doji' formations on weekly charts suggest some caution.
'Bearish Divergence' on RSI on the daily charts keeps upside limited. Further gains only on channel breakout.
Break below 21-EMA will see resumption of weakness. Immediate support is seen at 23.6% Fib at 98.44.
For details on FxWirePro's Currency Strength Index, visit http://www.fxwirepro.com/currencyindex.


Comment 0