 News
News  Coin Information
  About us
  Customer Service


XRP is hovering just above a key technical floor, with traders watching whether the token can defend the weekly support zone near $1.13 or slips into a deeper correction. The level has become the market’s immediate battleground as liquidity thins and price action tightens.
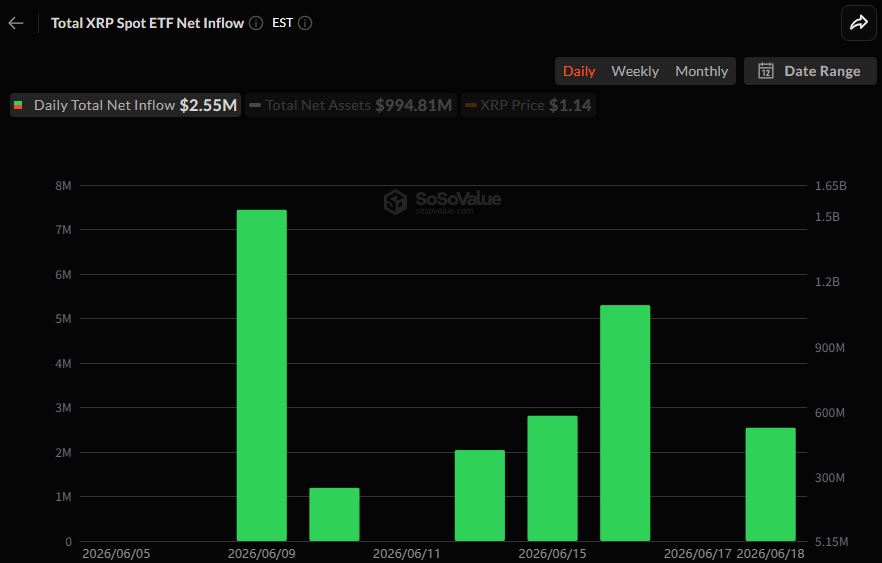
According to CoinMarketCap data dated June 20, XRP (XRP) was trading at $1.1451, up about 1.37% over the past 24 hours. The broader trend, however, remains mixed-to-negative: XRP is down 0.67% over seven days and off 16.11% over the past 30 days, underscoring persistent mid-term selling pressure. XRP’s market capitalization stood near $71.06 billion, keeping it in sixth place among cryptocurrencies by market cap.
Activity in the spot market has cooled noticeably. XRP’s 24-hour trading volume was about $955.6 million, down 46.88% from the prior day, a steep drop that suggests a more cautious stance among market participants and reduced short-term conviction.
Technically, analysts are framing the next move around two nearby thresholds: the weekly support at $1.13 and a short-term resistance area around $1.153. CryptoRank described $1.13 as one of the most important support levels of recent weeks, while noting that overall momentum still favors the downside. In a daily market note, MEXC added that after XRP recently lost the $1.15 support, that zone has effectively flipped into resistance—making the market’s reaction around $1.153 a key determinant of intraday direction.
Momentum indicators also reflect a market that is weak, but not capitulating. The relative strength index (RSI) was cited around 41.5, indicating that XRP is not in a pronounced oversold condition, while sellers still hold a modest edge.
Scenario analysis from CryptoRank outlines a narrow corridor for near-term price discovery. In a bullish case, a clean break above $1.153 could open room toward $1.17. A neutral outcome would likely keep XRP range-bound between $1.13 and $1.153. The bearish risk scenario remains the most closely monitored: a breakdown below $1.13 could expose support around $1.08–$1.10, with an extended decline potentially reaching the $0.90–$1.00 area if selling accelerates.
Beyond chart levels, XRP also received a narrative tailwind from Asia. The Hong Kong Institute for Monetary Research (HKIMR) released a report recognizing Ripple and XRP as credible tools for cross-border payments, citing advantages in cost efficiency and processing speed. DMarketForces reported that XRP rose roughly 2% following the coverage, briefly regaining the $1.15 handle. For market participants, the acknowledgement aligns with Ripple’s long-standing pitch of building real-time settlement infrastructure for global financial institutions, and it may help marginally improve sentiment by reinforcing the asset’s utility argument.
Still, longer-term uncertainty remains tied to the U.S. policy backdrop. Discussion around a proposed 'Clarity Act' has reportedly intensified across some XRP community channels, with calls for U.S. holders to engage lawmakers. Even so, there has been no confirmed announcement of major XRPL protocol upgrades or new product roadmaps from Ripple in this context, leaving regulatory clarity unresolved as a structural overhang on upside pricing.
For now, the market’s focus is straightforward: whether XRP can hold $1.13 while attempting to reclaim the $1.153 resistance zone. With a fully diluted valuation estimated around $114.5 billion, the token continues to reflect substantial implied optionality—but near-term direction is likely to be set by the interaction between thinning volume, the defense of support, and the incremental boost from institutional recognition such as HKIMR’s report.
🔎 Market Interpretation
- Price at inflection: XRP is consolidating near a decisive weekly support around $1.13, trading near $1.145 as liquidity thins and the market waits for a directional break.
- Momentum skew remains bearish: Despite a modest +1.37% (24h) bounce, XRP is -0.67% (7d) and -16.11% (30d), signaling persistent mid-term distribution/selling pressure.
- Participation cooling: 24-hour volume dropped to about $955.6M (-46.88%), implying reduced conviction and higher sensitivity to stops/liquidity pockets near key levels.
- Support/resistance map tight: The market is effectively range-bound between $1.13 support and $1.153 resistance (the former support near $1.15 has flipped to resistance).
- RSI suggests weakness, not capitulation: RSI near 41.5 indicates sellers have an edge, but conditions are not deeply oversold—leaving room for either a controlled bounce or further grind-down.
- Fundamental sentiment tailwind, but limited: HKIMR’s recognition of Ripple/XRP for cross-border payments adds a utility narrative boost, yet U.S. regulatory uncertainty remains a notable overhang.
💡 Strategic Points
- Key decision level (weekly): Watch $1.13. A sustained hold supports range-bound or rebound scenarios; a clean break increases odds of a deeper drawdown.
- Trigger for bullish continuation: A firm reclaim and hold above $1.153 (post-breakout confirmation) could open a path toward $1.17.
- Neutral/range play: If price remains trapped, expect churn between $1.13–$1.153, with whipsaw risk elevated given reduced volume.
- Downside roadmap if $1.13 fails: First support zone near $1.08–$1.10; if selling accelerates, extension risk toward $0.90–$1.00.
- Volume as confirmation tool: With volume sharply lower, treat any breakout/breakdown with caution unless accompanied by improving turnover and follow-through.
- Narrative catalyst monitoring: HKIMR coverage may help sentiment at the margin, but upside durability likely hinges on clearer U.S. policy signals (e.g., discussion around the proposed Clarity Act).
- Positioning context: XRP remains large-cap (≈ $71.06B market cap; FDV ≈ $114.5B), so near-term moves are likely driven by macro liquidity/market risk appetite plus technical levels rather than minor headlines alone.
📘 Glossary
- Weekly support: A price area on the weekly chart where buying historically appears; losing it often signals a larger corrective phase.
- Resistance / Support flip: A former support level that, once broken, tends to act as resistance when price retests it (e.g., $1.15 → $1.153).
- RSI (Relative Strength Index): Momentum oscillator (0–100). Readings below 50 often imply bearish momentum; below ~30 is commonly considered oversold.
- Range-bound: Price oscillates within a defined band (here, $1.13–$1.153) without a sustained trend.
- Liquidity thins: Fewer bids/asks in the order book; price can move more sharply on smaller orders.
- Spot volume: Real-time trading activity in the spot market; declining volume can reduce breakout reliability.
- Market cap: Circulating supply × price; indicates current network valuation (XRP ≈ $71.06B in the article).
- FDV (Fully Diluted Valuation): Total supply × price; a valuation proxy assuming all tokens are in circulation (XRP ≈ $114.5B in the article).


Comment 0