 News
News  Coin Information
  About us
  Customer Service


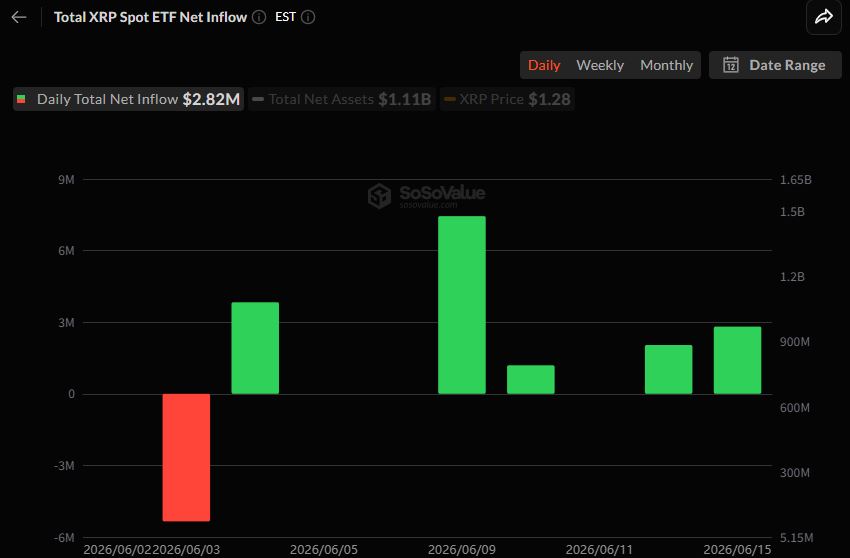
XRP is struggling to find a clear direction as traders weigh a tentative short-term rebound against a broader multi-week downtrend, with technical levels tightening into what analysts describe as a near-term decision point.
According to CoinMarketCap data, XRP was trading at $1.2167 as of 2026-06-16 21:00 UTC. The token posted a 24-hour trading volume of roughly $1.683 billion, down 44.6% from the prior day, suggesting fading participation even as price holds relatively steady. XRP’s market capitalization stood near $75.5 billion, ranking fifth among cryptocurrencies and representing about 3.34% of the total crypto market.
Price performance remains mixed across time frames. XRP slipped 0.61% over the past 24 hours, while the last 30 days show a cumulative decline of 12.68% and the 60-day measure extends that drawdown to 17.26%. Still, the token is up 9.08% over the past week, highlighting a short-term bounce attempt within an otherwise weakening structure.
Technicians are largely focused on a narrow range between the $1.13 support level and the $1.18–$1.19 resistance band. Coinpedia noted that $1.13 has repeatedly acted as a key weekly support during the current bearish phase, warning that a break below could undermine the broader medium- to long-term price structure by reopening lower liquidity zones.
On shorter time frames, analysts point to signs of a developing 'double bottom' pattern on the four-hour chart. If XRP can push through $1.18–$1.19 on meaningful volume and hold the move into the daily close, chart projections typically target a climb toward $1.24 and potentially $1.29—roughly a 9% to 10% extension from the breakout area. However, recent attempts to pierce the upper boundary have repeatedly failed to translate into a sustained close above resistance, implying that buyers have yet to demonstrate conviction.
Sentiment indicators reinforce the fragile backdrop. CoinCheckup’s Fear & Greed Index registered 23, placing the market in 'Extreme Fear' territory—often associated with defensive positioning and reluctance to chase rallies. Even as CoinCheckup’s broader technical outlook labels the setup 'neutral,' the disconnect between neutral technical framing and deeply negative sentiment underscores the market’s uncertainty.
CoinCheckup also projects XRP could drift slightly lower toward about $1.23 over the next month and estimates 30-day volatility at 8.23%. Of the last 30 trading days, XRP closed higher on 12 sessions—about 40%—a pattern consistent with choppy, range-bound trading rather than a trending advance. Pivot-based levels cited in the report place nearby supports at $1.18, $1.12, and $1.07, while resistances are mapped at $1.29, $1.34, and $1.40.
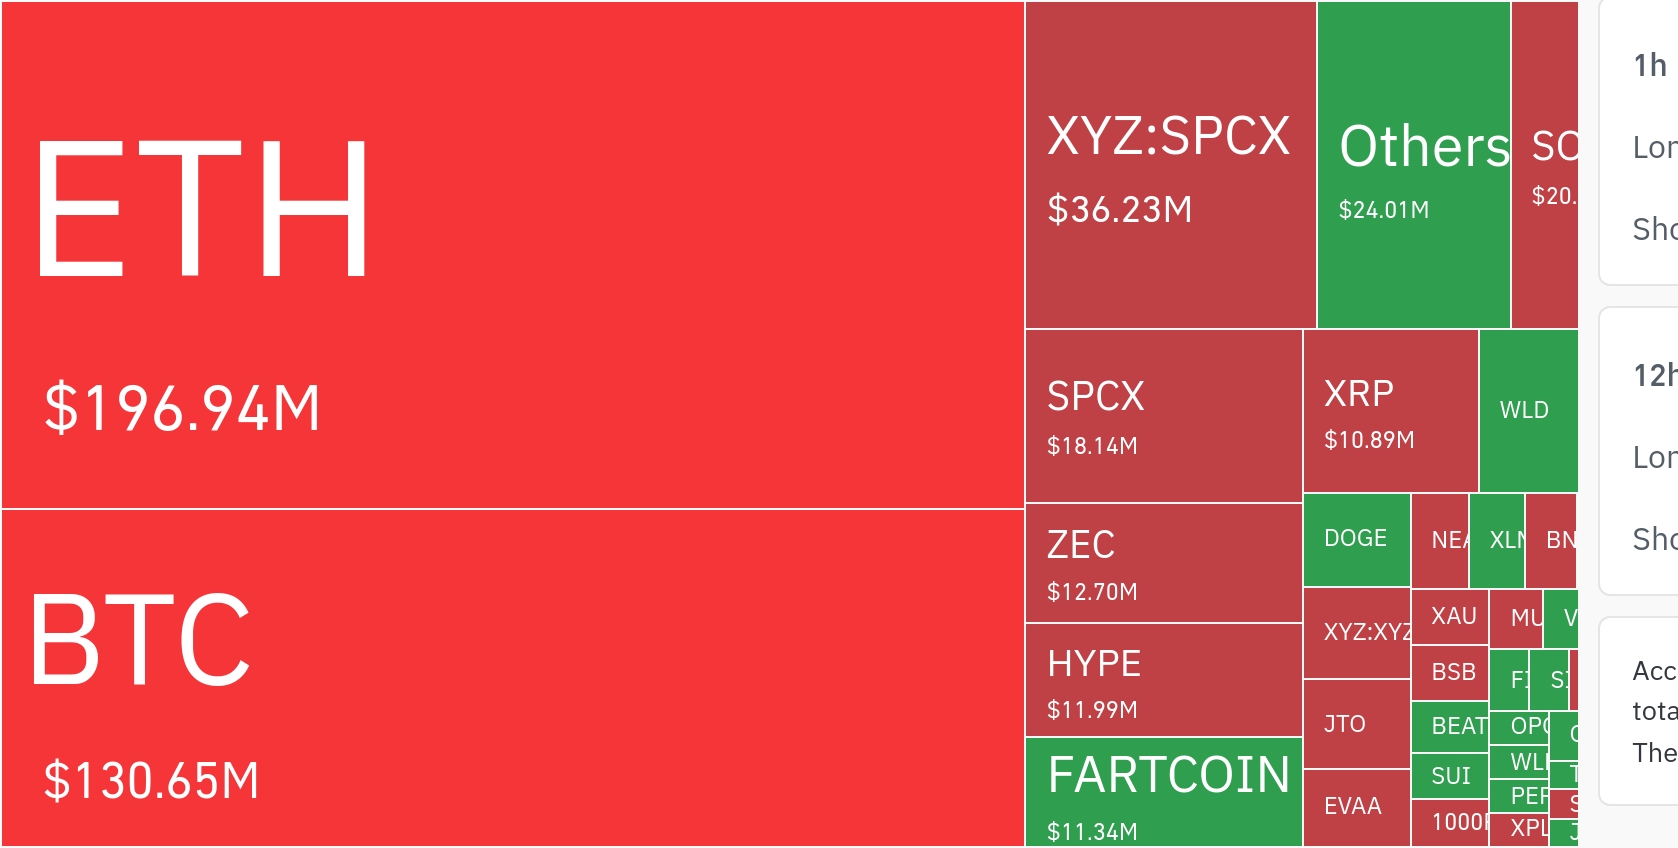
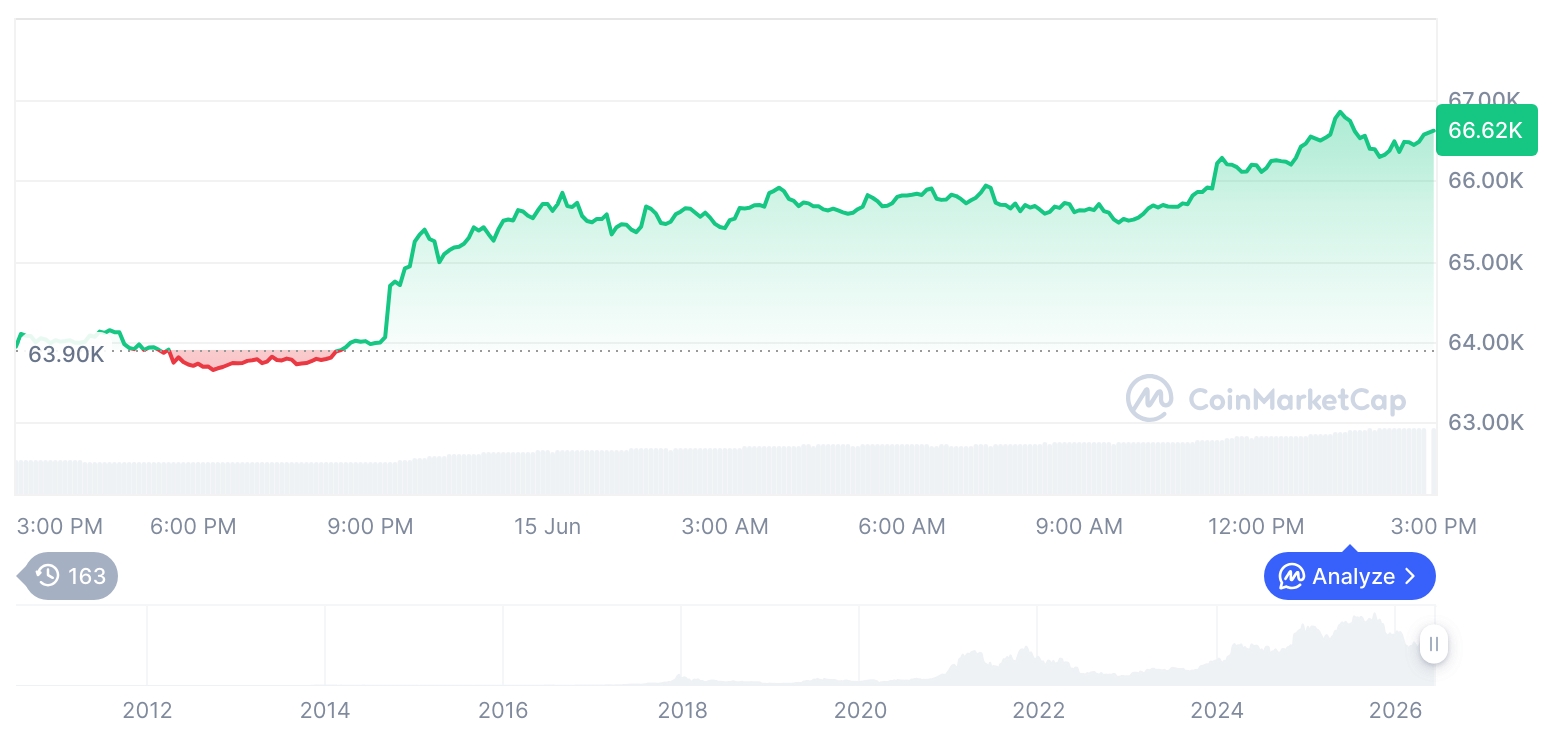
A notable feature of the current cycle is XRP’s continued 'underperformance' versus Bitcoin (BTC) during broader market stabilization. Coinpedia argued that the larger bearish trend has not been decisively reversed and that structural confirmation of a durable long-term bottom remains absent. While some market chatter has pointed to potentially positive Ripple developments—including references to large-scale Africa payments activity—traders have not treated the narrative as an immediate catalyst in spot pricing.
For now, XRP’s next meaningful move appears tethered to whether it can defend $1.13 and whether buyers can secure a sustained break above $1.19. A confirmed breakout would shift attention toward the $1.24 and $1.29 zones, while a loss of foundational support could intensify downside pressure as liquidity pockets open below.
🔎 Market Interpretation
- Price is compressing into a decision zone: XRP is range-bound between $1.13 support and $1.18–$1.19 resistance, with repeated rejections at the upper band signaling hesitation and reduced bullish follow-through.
- Short-term bounce vs. multi-week downtrend: Despite being up ~9.08% on the week, XRP remains down ~12.68% (30D) and ~17.26% (60D), implying the rebound may be corrective unless key resistance is reclaimed.
- Participation is fading: 24H volume fell ~44.6% to ~$1.683B while price stayed near $1.2167, a common sign of a weakening rally attempt and lower conviction on both sides.
- Sentiment is heavily risk-off: Fear & Greed at 23 (“Extreme Fear”) suggests traders are reluctant to chase strength; this can precede sharp rebounds, but also aligns with breakdown risk if support fails.
- Relative weakness persists: Continued underperformance versus BTC during broader stabilization indicates XRP has not regained leadership, reinforcing the view that a durable long-term bottom is not yet confirmed.
💡 Strategic Points
- Primary trigger levels:
- Bull case confirmation: A daily close above $1.18–$1.19 on meaningful volume would strengthen the double-bottom thesis and shift focus to $1.24 then $1.29.
- Bear case confirmation: A break and hold below $1.13 risks reopening lower “liquidity zones,” with next mapped supports around $1.12 and $1.07.
- Use volume as the “truth filter”: Given repeated failed pushes at resistance, traders may watch for volume expansion on a breakout; low-volume moves are more prone to reversals back into the range.
- Expect range behavior until proven otherwise: With only 12 of the last 30 sessions closing higher and projected 30D volatility ~8.23%, conditions favor choppy mean-reversion rather than a clean trend.
- Map upside layers beyond the first breakout: If $1.29 is reclaimed, cited resistances extend to $1.34 and $1.40, which may act as profit-taking or re-entry decision points.
- Narratives not priced yet: Market chatter about Ripple-related developments (e.g., Africa payments activity) has not translated into spot momentum—technicals remain the dominant near-term driver.
📘 Glossary
- Support: A price area where buying interest historically emerges, helping prevent further declines (here: $1.13 is the key weekly level mentioned).
- Resistance: A price area where selling pressure tends to appear, limiting advances (here: $1.18–$1.19 is the near-term ceiling).
- Double Bottom: A chart pattern where price tests a low twice and then breaks above intervening resistance, often interpreted as a potential trend reversal if confirmed by a strong close and volume.
- Liquidity Zone/Pocket: A region with clustered orders/stop-losses that can accelerate price movement once entered, often causing sharper swings after key levels break.
- Daily Close Confirmation: Using the end-of-day closing price to validate that a breakout or breakdown “sticks,” reducing false-signal risk from intraday spikes.
- Fear & Greed Index: A sentiment gauge; low readings (e.g., 23) indicate risk aversion and defensive positioning.
- Pivot Levels: Predefined support/resistance markers derived from prior price action; used to anticipate where price may react (supports: $1.18/$1.12/$1.07, resistances: $1.29/$1.34/$1.40).


Comment 0