ETH/USD chart - Trading View
Exchange - Coinbase
Support: 239.64 (236% Fib); Resistance: 255.55 (20-DMA)
Technical Analysis: Bias Neutral to Slightly Bearish
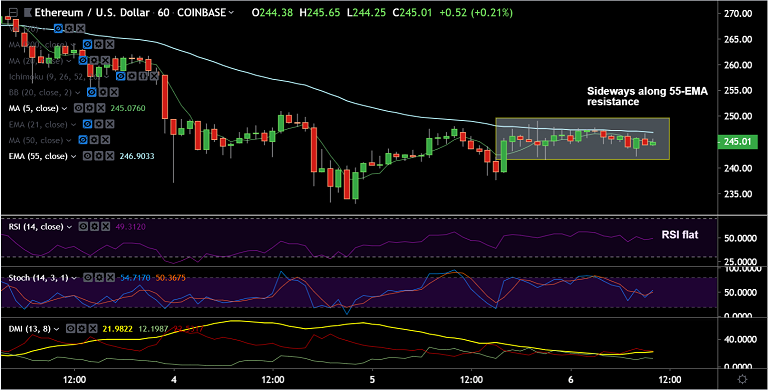
ETH/USD grinds sideways at 1H 55-EMA resistance, downside supported at 1H 50-SMA.
RSI and Stochs are flat-lined on the hourly charts, intraday bias is neutral.
Price action has bounced off lower BB and is hovering around 21-EMA.
Technical analysis supports downside. Doji formation on previous weeks' candle limits upside.
Bearish 5-DMA crossover on 20-DMA, 'Bearish Divergence' on RSI and stochs keeps bias lower.
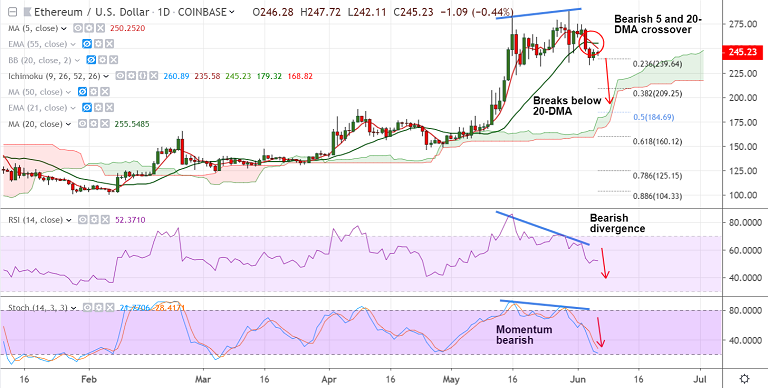
Volatility is shrinking on the daily charts, scope for some consolidation.
Break below 23.6% Fib eyes 55-EMA at 215.45. Retrace above 20-DMA could see further gains.
For details on FxWirePro's Currency Strength Index, visit http://www.fxwirepro.com/currencyindex.








Comment 1