LTC/USD chart - Trading View
Exchange - Coinbase
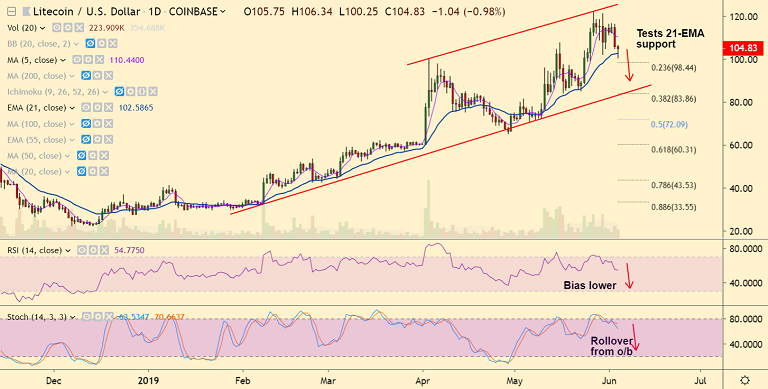
Support: 98.44 (23.6% Fib); Resistance: 110.57 (5-DMA)
Technical Analysis: Bias Bearish
LTC/USD tests 21-EMA, hits 2-week lows at 100.25 before paring some losses.
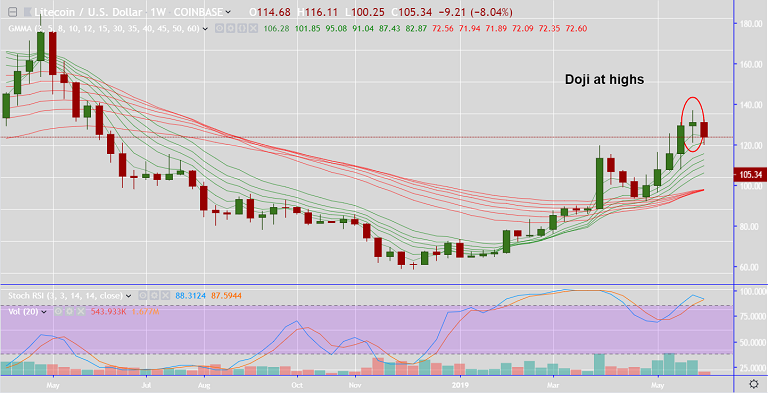
Doji formation on the previous weeks candle raises scope for downside.

Stochs and RSI have rolled over from overbought levels, bias lower.

MACD is showing a bearish crossover on signal line. -ve DMI crossover on +ve DMI.
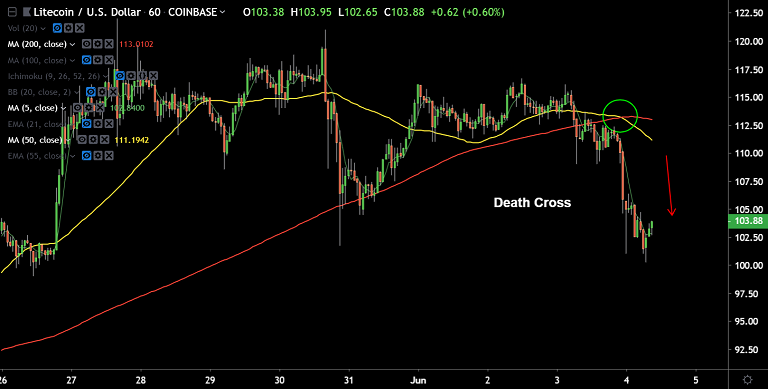
'Death Cross' formation on the hourly charts adds to the bearish bias.
Close below 21-EMA will see dip till 83.10 (channel base). Failure to close below 21-EMA will see consolidation.
For details on FxWirePro's Currency Strength Index, visit http://www.fxwirepro.com/currencyindex.


Comment 0