
 Add as a preferred source on Google
NEAR Surges 72% as Altcoins Rally Signals Bifurcated Market Liquidity
Near Protocol leads a sharp altcoin rally with a 72% weekly gain as market data shows concentrated capital inflows and increasingly bifurcated liquidity across crypto assets.


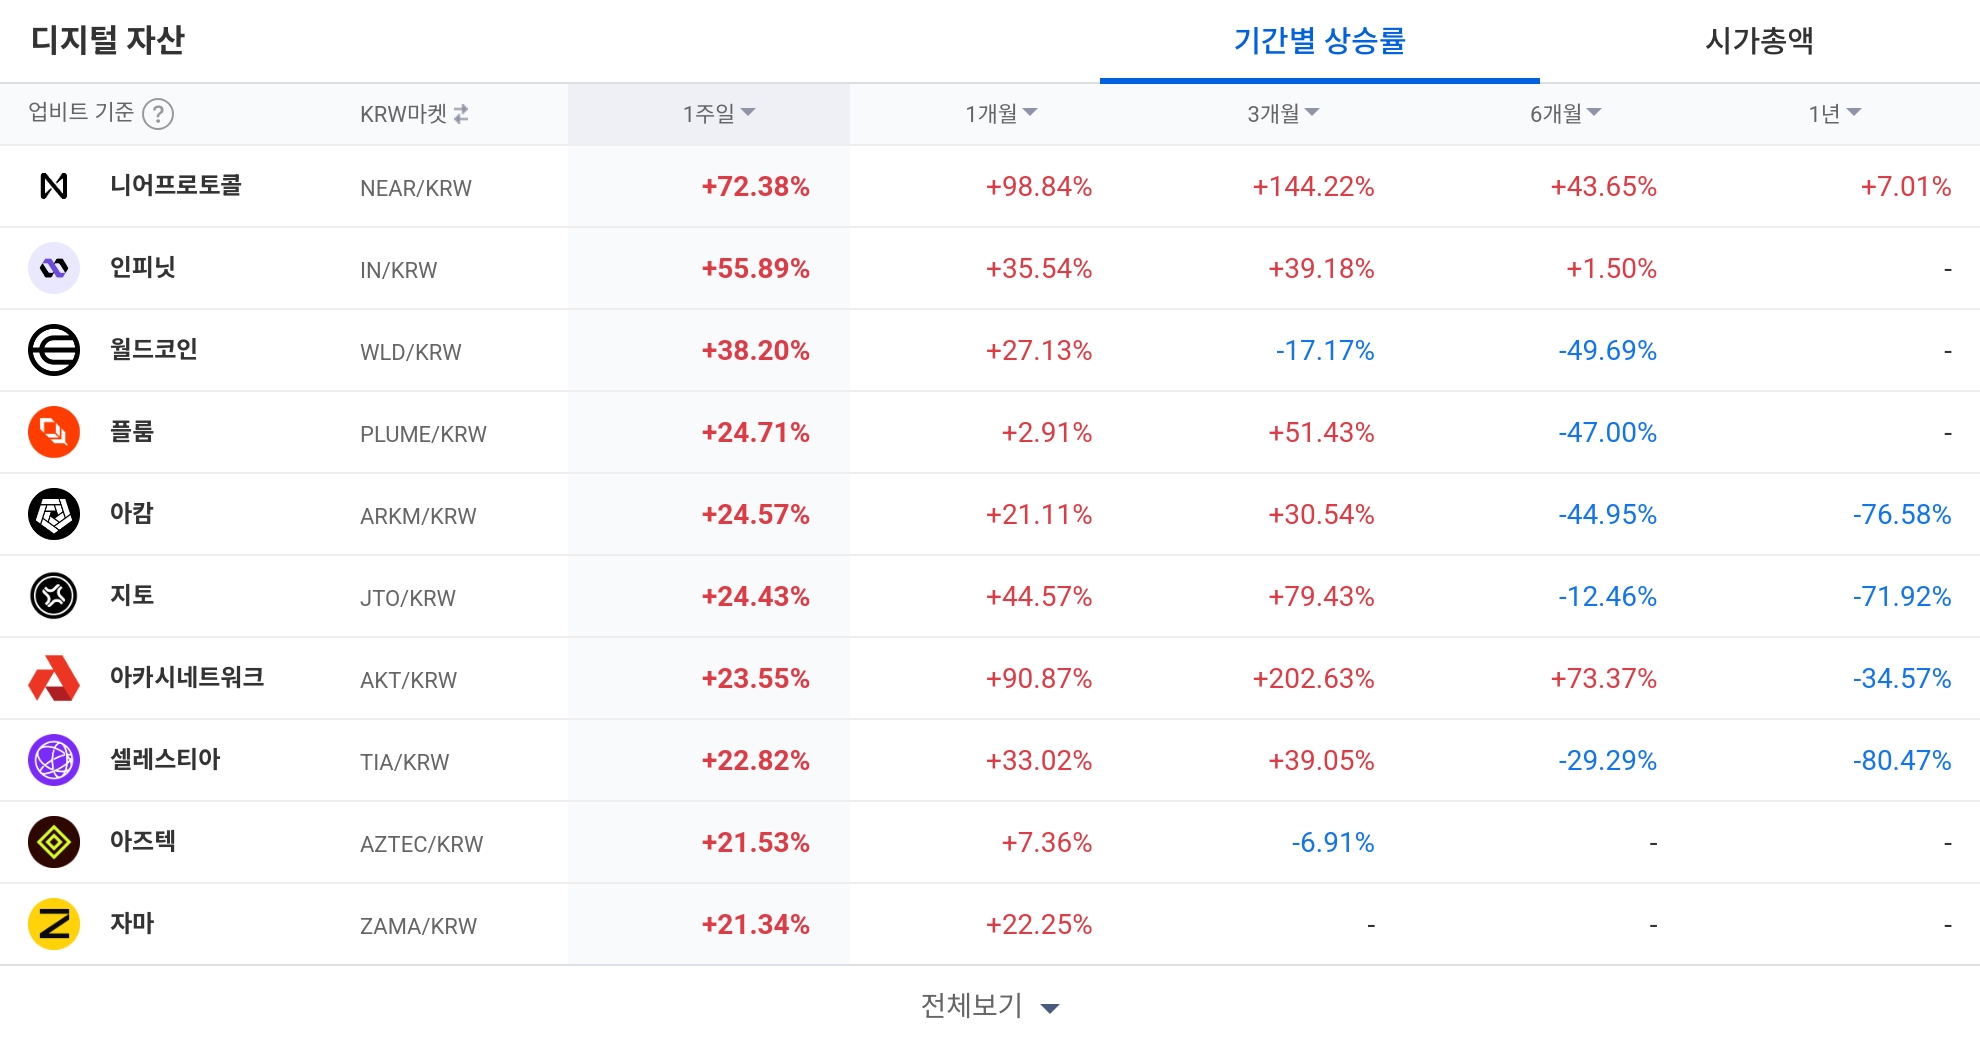
Altcoins posted sharp weekly gains in late May, with Near Protocol (NEAR) standing out as one of the clearest examples of accelerating short-term momentum across multiple time frames—an expansion in risk appetite that is also showing signs of increasingly polarized order flow.
As of May 26 at 00:05 UTC (weekly performance measured at 00:10 UTC), market data tracking top movers showed a rare overlap between coins leading the weekly surge list and those ranking highly on longer lookback returns. The convergence suggests traders are rotating capital toward assets with visible trend persistence, rather than isolated one-off spikes.
Near Protocol (NEAR) drew the most attention. Against Bitcoin (BTC), NEAR led the weekly performance table with a gain of about 72%. In the Korean won (KRW) market, it also logged broad-based strength across multiple periods: up 72.38% over one week, 98.84% over one month, 144.22% over three months, 43.65% over six months, and 7.01% over one year. That mix—strong near-term follow-through without a deeply negative one-year backdrop—helped position NEAR as a focal point for momentum-driven flows.
Other notable weekly gainers included Infinit (IN), which rose nearly 60% over the week in KRW trading, and Worldcoin (WLD), up roughly 37%. However, their longer-term profiles diverged. IN remained positive across shorter lookbacks—up 55.89% over one week, 35.54% over one month, and 39.18% over three months—while its six-month return was comparatively muted at 1.50%, pointing to a more recent momentum turn. WLD showed a clearer short-term rebound—up 38.20% over one week and 27.13% over one month—but remained underwater over three months (-17.17%) and six months (-49.69%), underscoring the asset’s elevated volatility and sensitivity to sentiment shifts.
Mid-term momentum was particularly strong in Akash Network (AKT), which posted a 202.63% gain over three months and 90.87% over one month, reinforcing its place among the period leaders. Jito (JTO) also advanced across the same windows, rising 79.43% over three months and 44.57% over one month. In contrast, some tokens highlighted the growing gap between short-term rebounds and longer-term drawdowns: Arkham (ARKM) was down 76.58% over one year, while Celestia (TIA) was down 80.47% over the same period—figures that suggest many rallies are still occurring within broader recovery attempts rather than fully restored multi-quarter uptrends.
The weekly top-10 list was dominated by BTC-paired winners, including AltLayer (ALT), Plume (PLUME), Orchid (OXT), Caldera (ERA), Virtual Protocol (VIRTUAL), Sershingt (PROVE), and Render (RENDER). Analysts often read BTC-pair strength as a sign that an altcoin is outperforming the market’s benchmark rather than simply rising with a generalized crypto upswing—though such bursts can reverse quickly when liquidity thins.
Order-flow indicators also pointed to a more extreme split in positioning. In daily 'buy execution intensity' rankings—an exchange metric used to gauge whether trades are skewing toward aggressive buying—several tokens printed the maximum observed reading of 500% at the same timestamp. IOTA (IOTA), Beam (BEAM), Sentient (SENT), Yield Guild Games (YGG), and Cow Protocol (COW) all registered 500%, suggesting concentrated buying pressure that can reflect either sudden catalysts or short-lived overheating.
At the other end of the spectrum, daily 'sell execution intensity' showed a cluster of tokens at 0%, signaling overwhelming sell-side dominance. Zilliqa (ZIL), QuarkChain (QKC), Moss Coin (MOC), Theta Fuel (TFUEL), and Ankr (ANKR) all recorded 0%—a pattern that highlights how liquidity is fragmenting, with capital crowding into a narrow set of winners while other names face persistent distribution.
Overall, the May 26 snapshot captured a market characterized by sharp weekly breakouts—led by NEAR—alongside increasingly 'bifurcated liquidity' as traders piled into select tokens while abandoning others. If the current momentum persists, the rally could broaden; if it fades, the same concentration visible in execution metrics could amplify volatility as crowded positions unwind.
Article Summary by TokenPost.ai
🔎 Market Interpretation
Altcoin risk-on pulse: Late-May trading showed sharp weekly breakouts, led by Near Protocol (NEAR), indicating a clear uptick in short-term risk appetite.
Trend persistence over one-off spikes: A rare overlap appeared between weekly top gainers and longer lookback leaders, implying capital rotation toward assets with continuing momentum rather than isolated pumps.
NEAR as the momentum benchmark: NEAR outperformed versus BTC (~+72% on the week) and posted strong KRW returns across 1W (+72.38%), 1M (+98.84%), 3M (+144.22%), while keeping a mildly positive 1Y (+7.01%), making it a focal point for systematic and discretionary momentum flows.
Dispersion rising beneath the rally: Some tokens rebounded short-term (e.g., WLD +1W, +1M) but remained deeply negative over 3–6 months, highlighting that many moves are occurring within broader recovery attempts rather than renewed multi-quarter uptrends.
BTC-pair strength as “true outperformance” signal: Weekly leaders in BTC pairs suggest outperforming the market benchmark, though the article flags that these bursts can reverse quickly when liquidity thins.
Liquidity bifurcation: Execution-intensity metrics show simultaneous pockets of extreme buying and extreme selling, signaling fragmented liquidity and potentially unstable, crowded positioning.
💡 Strategic Points
Prioritize multi-timeframe alignment: Tokens with strength across 1W/1M/3M (e.g., NEAR; also AKT and JTO in mid-term windows) may be better positioned than assets driven by a single short-term spike.
Use longer lookbacks to filter “dead-cat” rallies: Names like WLD with negative 3M/6M returns despite weekly gains may carry higher reversal risk and require tighter risk controls.
Watch BTC-paired leaders for rotation signals: A sustained bid in BTC pairs (ALT, PLUME, OXT, ERA, VIRTUAL, PROVE, RENDER) can imply genuine relative strength; fading BTC-pair performance can be an early warning that the move is losing quality.
Interpret execution-intensity extremes as crowding indicators: 500% buy execution intensity (IOTA, BEAM, SENT, YGG, COW) can reflect catalysts or overheating—use it to identify potential continuation trades or exhaustion points depending on follow-through.
Understand the “abandoned” side of the tape: 0% sell execution intensity (ZIL, QKC, MOC, TFUEL, ANKR) suggests heavy sell-side dominance and weak sponsorship; relative weakness may persist until flows normalize.
Plan for amplified volatility: Concentrated winners plus thin liquidity can accelerate both upside continuation and downside unwinds; position sizing and exit rules matter more in bifurcated markets.
Rally-breadth trigger: If leadership broadens beyond a narrow cluster of BTC-pair winners and execution extremes moderate, it may signal a healthier, more durable expansion; if not, crowding risk remains elevated.
📘 Glossary
Altcoin: Any cryptocurrency other than Bitcoin; typically higher beta and more sensitive to risk sentiment.
BTC pair / BTC-paired performance: An altcoin’s performance measured against Bitcoin (e.g., NEAR/BTC). Strength here implies relative outperformance versus BTC, not just USD price appreciation.
Lookback window (1W/1M/3M/6M/1Y): Performance measured over one week, one month, three months, six months, and one year.
Order flow: The balance and behavior of buy vs. sell activity (aggressive vs. passive), often used to infer who controls the market.
Buy execution intensity: An exchange metric indicating how aggressively buys are being executed versus typical levels; very high readings can indicate strong demand or crowded chasing.
Sell execution intensity: A metric signaling how dominant sell execution is; extremely low readings in the article’s framing indicate overwhelming sell-side dominance.
Bifurcated liquidity: A market condition where capital concentrates into a small set of winners while other assets see persistent outflows, increasing dispersion and instability.
Momentum-driven flows: Trading behavior where capital follows recent price strength, often reinforcing trends until exhaustion or a catalyst reverses sentiment.