 News
News  Coin Information
  About us
  Customer Service


Ripple (XRP) has entered a short-term consolidation phase after a recent rally, with prices struggling to establish a clear directional trend. While several leading AI models broadly agree the token is in a ‘pullback during a rebound attempt,’ they diverge on whether the next move is more likely to be a continuation higher or a deeper retracement.
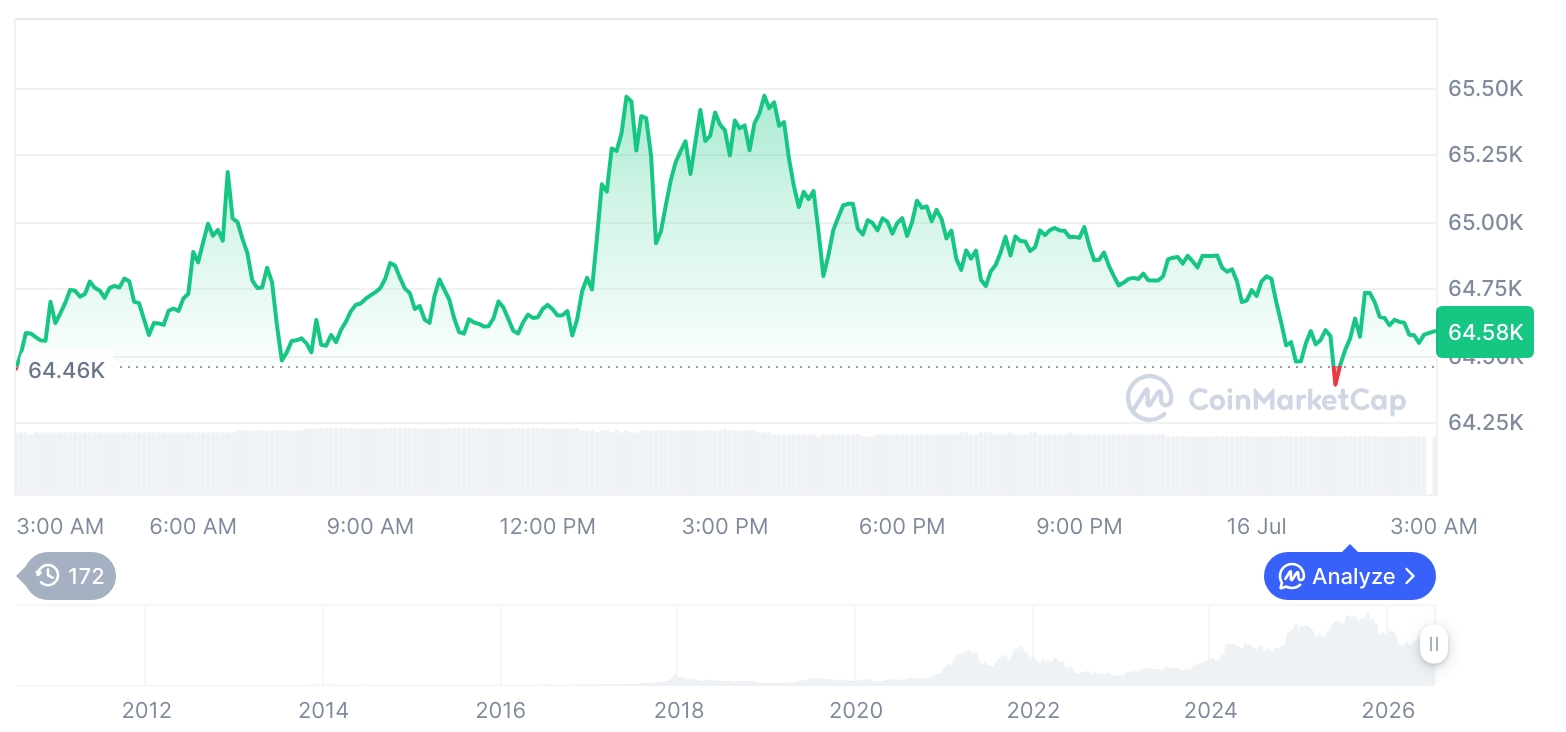
XRP climbed from roughly $1.31 to $1.47 before slipping into a tight range around $1.43. Momentum indicators remain constructive on the surface—its relative strength index (RSI) is near 57, a level that typically signals neither overbought nor oversold conditions and leaves room for additional upside. However, market participation has cooled: volume fell sharply after the local peak, suggesting that ‘chasing demand’ is fading and that the rally may need fresh catalysts to extend.
From a broader technical standpoint, analysts still characterize the move as a rebound inside a longer-term downtrend. XRP remains below its 200-day simple moving average (SMA200), cited around $1.88, reinforcing the view that the larger structure is still bearish. At the same time, the token is holding above a key Fibonacci retracement level (0.786), a development some traders interpret as an early sign of a potential trend change—provided support levels continue to hold.
In a probability-based framework, GPT-5.2 described XRP as a ‘technical bounce within a downtrend,’ assigning a modest 55% chance to a continued rebound. The model suggested that a break above $1.45 could open the door to a test of $1.48, but it emphasized $1.32 as the critical near-term pivot: losing that level could quickly shift the structure toward a deeper selloff.
Claude Sonnet 4.6 took a more cautious stance, focusing on the post-rally volume drop as a warning sign that buyer conviction is weakening. It ranked the short-term downside scenario as the most likely among its outcomes, placing comparatively higher weight on a pullback if activity fails to recover. Still, it noted that if XRP can defend roughly $1.42 and volume begins to rebuild, a renewed attempt toward $1.50 remains plausible.
xAI 4.1 was the most optimistic of the three, pointing to RSI momentum and signs of increased volume during the prior push as evidence that buyers could reassert control. It estimated a 65% probability of a rebound continuation, arguing that a sustained defense of $1.39 would keep XRP positioned for a retest of the $1.48–$1.50 region. The model highlighted a rise of more than 200 million in trading volume near the highs, interpreting it as a possible signal of ‘institutional and whale’ participation—though such inferences remain probabilistic and difficult to confirm definitively without broader order-flow data.
Across the models, the key takeaway is that XRP is trading at a decision point where short-term momentum is colliding with a still-fragile longer-term trend. The $1.42–$1.45 band is widely framed as the near-term equilibrium zone, with resistance clustered around $1.48–$1.50 and notable downside checkpoints spanning $1.39 down to $1.32.
Over the next 24 hours, the scenarios consolidate into three paths. First, a clean move above $1.45 paired with a visible pickup in volume could drive a test of $1.48 and potentially $1.50. Second, a breakdown below $1.42 may widen the correction toward $1.36–$1.32. Third, if volume continues to fade, XRP could remain range-bound, with price chopping within the current band as traders wait for clearer signals.
For now, the market’s focus is on whether liquidity returns and whether support zones hold under pressure. RSI, the SMA200, and Fibonacci retracement levels are widely used tools for gauging momentum, long-term trend direction, and potential support/resistance during corrections. But their output is inherently probabilistic, and XRP—like the broader crypto market—can react sharply to macro conditions and shifts in ‘liquidity inflow,’ making near-term forecasting especially fragile during volatility spikes.
🔎 Market Interpretation
- Current state: XRP is consolidating after a rally from ~$1.31 to ~$1.47, now ranging near ~$1.43 with no clear short-term trend.
- Momentum vs participation: RSI near 57 suggests neutral-to-constructive momentum (room for upside), but post-peak volume weakened, implying fading follow-through demand.
- Higher-timeframe bias: Despite the bounce, XRP remains below the 200-day SMA (~$1.88), keeping the broader structure framed as a rebound inside a longer-term downtrend.
- Key technical inflection: Holding above the 0.786 Fibonacci retracement is viewed as a supportive sign, but confirmation depends on defending nearby supports and reclaiming resistance with volume.
- Model consensus: All models broadly describe a pullback during a rebound attempt, but differ on whether the next move favors continuation or deeper retracement.
- Near-term map (24h):
- Bull case: Break/hold above $1.45 with volume expansion → test $1.48, potentially $1.50.
- Bear case: Lose $1.42 → correction toward $1.36–$1.32.
- Neutral: Continued volume fade → range-bound chop around $1.42–$1.45.
💡 Strategic Points
- Equilibrium zone to watch: $1.42–$1.45 is the market’s decision band; behavior here (especially volume) likely dictates the next directional move.
- Resistance stack: $1.48–$1.50 is highlighted as the primary upside test zone; repeated rejection without volume could reinforce consolidation or trigger pullback.
- Support ladder: First supports near $1.39 then deeper pivot at $1.32; a break below $1.32 is framed as a potential shift toward a more pronounced selloff.
- Volume as confirmation: Upside scenarios emphasize that price strength is more credible if accompanied by rising liquidity/volume, addressing the reported drop in participation after the rally.
- Model probability framing:
- GPT-5.2: ~55% chance of continued rebound; bullish trigger above $1.45, key risk level $1.32.
- Claude Sonnet 4.6: More cautious; downside considered most likely if volume fails to recover; constructive if $1.42 holds and activity rebuilds.
- xAI 4.1: Most optimistic; ~65% rebound-continuation odds; emphasizes defending $1.39 and retesting $1.48–$1.50.
- Risk context: Indicators are probabilistic; XRP can react sharply to macro shifts and liquidity inflows, so volatility spikes can invalidate near-term setups.
📘 Glossary
- Consolidation: A period of sideways trading where price moves within a defined range as buyers and sellers reach temporary balance.
- Pullback: A short-term decline within a broader move (often after a rally), not necessarily signaling a full trend reversal.
- RSI (Relative Strength Index): A momentum oscillator (0–100). Around 50–60 is typically neutral; higher suggests stronger momentum, lower suggests weakness.
- Volume: The amount traded over a period; rising volume can confirm breakouts, while falling volume can signal weakening conviction.
- SMA200 (200-day Simple Moving Average): A long-term trend gauge; price below SMA200 is commonly interpreted as a bearish higher-timeframe backdrop.
- Fibonacci retracement (0.786): A technical level used to estimate potential support/resistance during corrections; holding above it can be interpreted as resilience.
- Pivot / key level: A price area that, if broken, can change the market’s short-term structure and accelerate movement.
- Liquidity inflow: New capital/participation entering the market; often reflected in increasing volume and tighter spreads, supporting sustained trends.


Comment 0