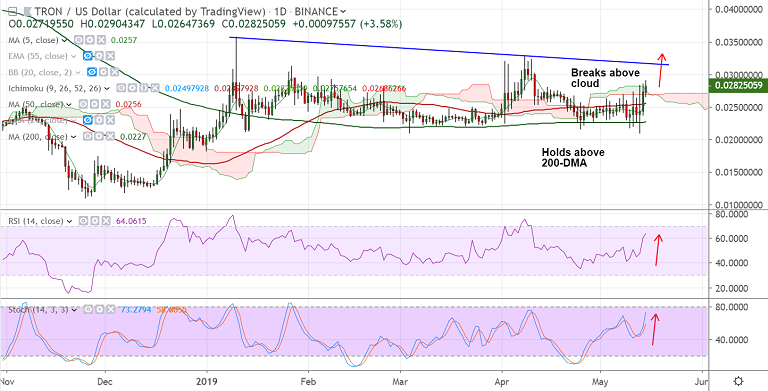
TRX/USD chart - Trading View
Exchange - Binance
Support: 0.0256 (50-DMA); Resistance: 0.0315 (trendline)
Technical Analysis: Bias Bullish
TRON has broken out of consolidation phase, could build upside momentum
TRX/USD trade had been capped between 200 and 50 day moving averages
Price action has now broken above 50-DMA and has edged above daily cloud
Volatility is rising as indicated by widening Bollinger Bands, Stochs and RSI are sharply higher
Scope for upside till 0.0315 (trendline resistance) and then 0.0327 (Apr 8th high)
Failure at daily cloud will see retrace till 50-DMA at 0.0256. Break below 200-DMA to see major downside
For details on FxWirePro's Currency Strength Index, visit http://www.fxwirepro.com/currencyindex.













Comment 0