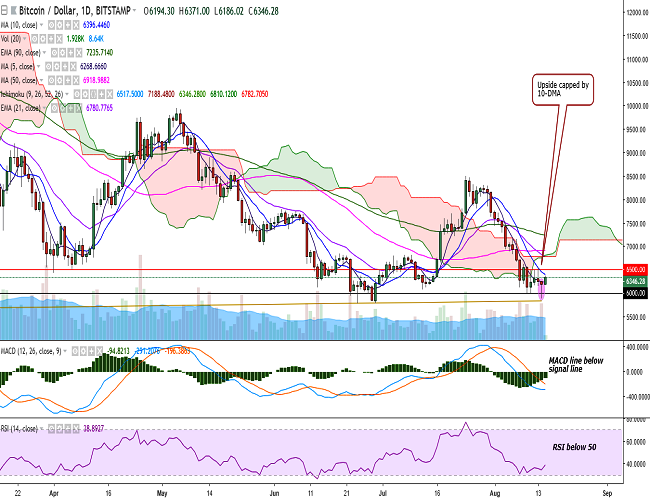
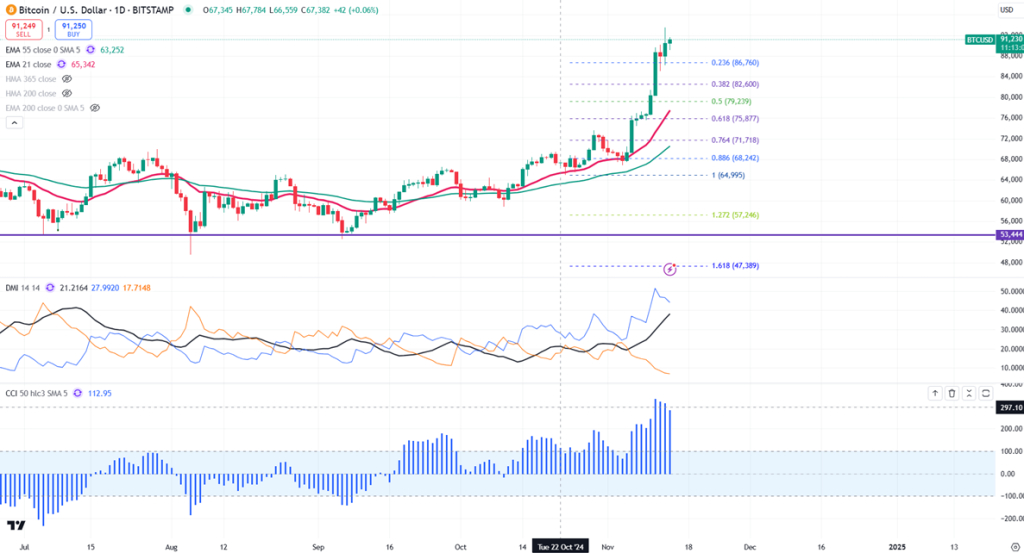
(Refer BTC/USD chart on Trading View)
BTC/USD closed at 6193 levels on Tuesday after hitting a low of 5880 levels, forming a hammer pattern.
The pair is currently trading at 6367 levels at the time of writing with its upside capped by 10-DMA (Bitstamp).
On the upside, the pair faces stiff resistance at 6393 (10-DMA) and a break above would see it testing 6497 (23.6% retracement of 8496.96 and 5880)/6600. Further strength would target 6701 (4h 90-EMA)/6782 (cloud bottom).
On the downside, support is likely to be found at 6233 (1h 100-SMA) and any violation would see it testing 6120 (June 13 low)/6000. Further weakness would drag the pair to 5880 (August 14 low)/5820 (trend line joining 5555.55 and 5774.72)/5780 (June 24 low).
On the daily chart, MACD line is below the signal line, while RSI is showing a turn from near oversold levels and stochs appear on the verge of a rollover from the oversold zone. In addition, the hammer pattern leaves open the scope for further upside.
Watch out for a decisive break above 6500 levels for minor bullishness in the pair.
<Copyright ⓒ TokenPost, unauthorized reproduction and redistribution prohibited>





Comment 0