

 News
News  Coin Information
  About us
  Customer Service


 Add as a preferred source on Google

Bitcoin (BTC) rebounded to $64,784 on Wednesday ET, easing some of the market’s recent stress, but the recovery is being met with a notable decline in trading activity and renewed inflows to exchanges—signals that suggest the move may lack broad conviction.
As of 12:01 a.m. ET on July 15 (based on Korea’s 1:01 p.m. KST update), BTC was up 3.71% on the day. The bounce marks a clear short-term stabilization after a steep pullback, though market data indicates the advance looks more like a ‘recovery attempt’ than a decisive trend reversal.
Spot trading volume fell to about $28.93 billion, down 15.79% from the prior day, according to CoinMarketCap data cited in the report. In practice, rising prices on shrinking volume are often interpreted as a weaker rally, as fewer participants are driving the move. Analysts typically look for a fresh ‘liquidity inflow’—either from stablecoin deployment or new risk appetite—to sustain upside momentum.
Recent price action also underscores how fragile sentiment remains. Over the past five sessions, BTC posted declines on July 11 (-0.53%), July 12 (-0.06%), and July 13 (-2.27%), followed by a sharp rebound on July 14 (+4.35%) and a modest pullback on July 15 (-0.40%). The pattern points to a market leaning toward recovery but still trapped in elevated volatility.
Macro cross-asset signals were mildly supportive. The S&P 500 rose while gold slipped, reflecting a partial return of ‘risk-on’ positioning and reduced demand for traditional safe havens. That backdrop can help BTC in the short run, though crypto traders often remain sensitive to rapid shifts in broader financial conditions.
Technical indicators sent mixed messages. Daily MACD was positive at 55.35, suggesting improving short-term momentum, but weekly MACD remained deeply negative at -5,798.35, indicating the medium-term trend is still bearish. The divergence implies that while short-term traders may be testing the upside, longer-horizon participants have yet to see confirmation that the broader downtrend has ended.
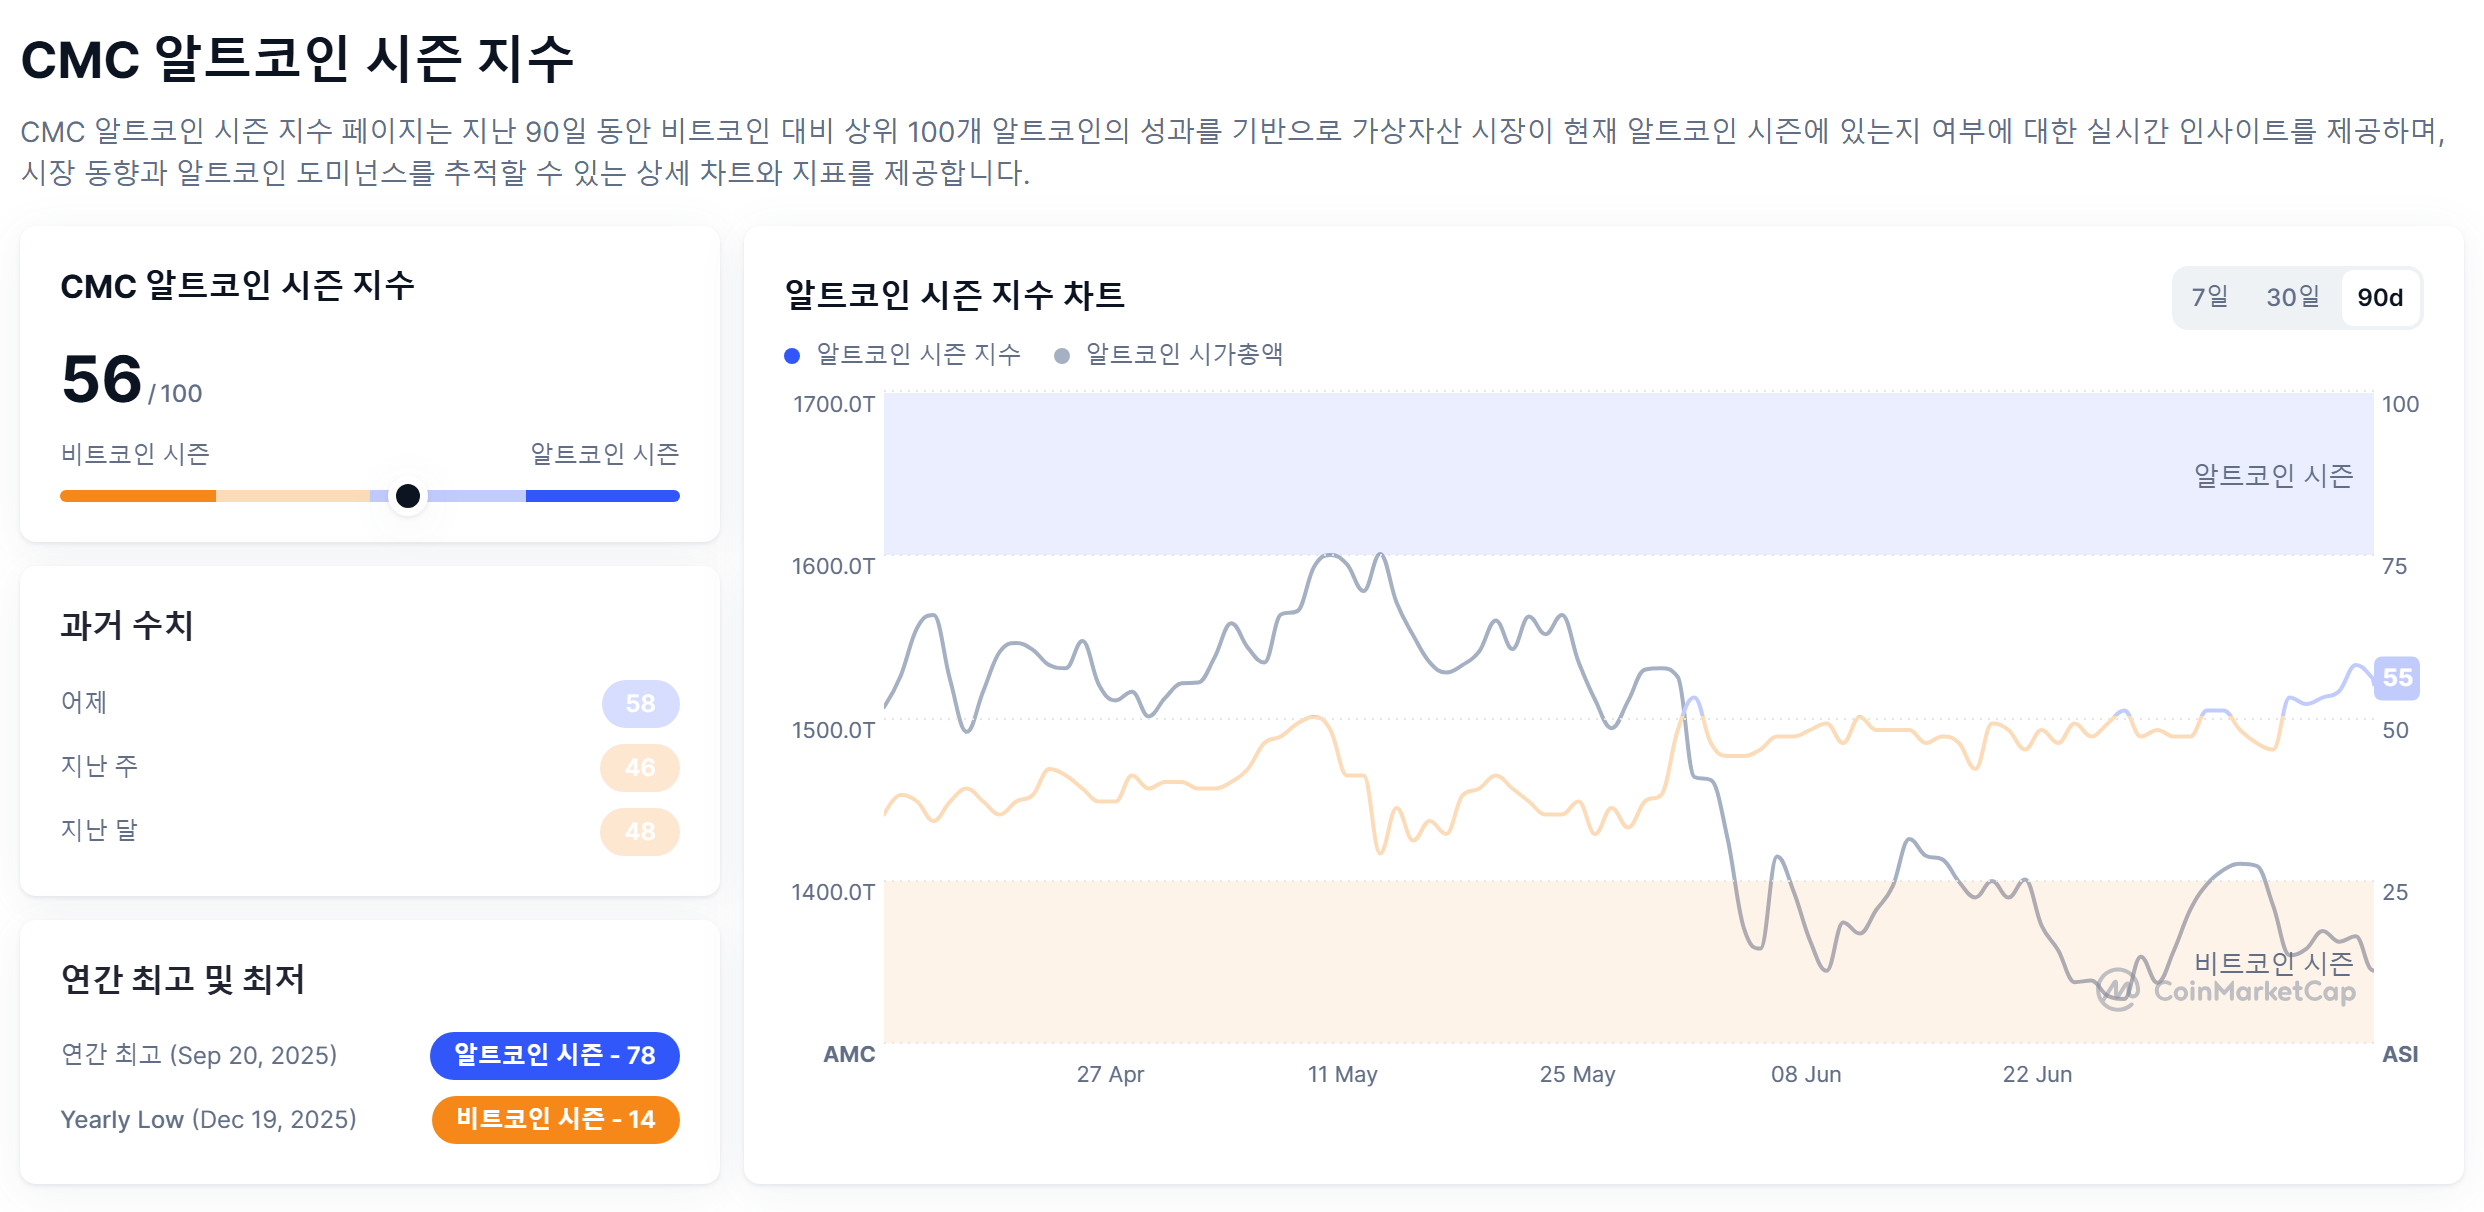
Market positioning also showed continued preference for Bitcoin over altcoins. BTC dominance rose to 58.46% (+0.22%), typically interpreted as a rotation into perceived higher-quality crypto assets during periods of uncertainty. At the same time, the Fear & Greed Index stood at 25—still in ‘extreme fear’ territory—though it improved versus both the previous day and the prior week, hinting at a gradual thaw in sentiment from panic levels.
Retail attention, however, appeared to soften. Google Trends interest slipped to 45 from 55 a day earlier, suggesting the rebound has not yet reignited broad public engagement. Historically, sustained bull legs tend to coincide with expanding participation, while quieter rebounds can fade if follow-through buying fails to materialize.
On-chain and exchange metrics pointed to potential near-term headwinds. The Stablecoin Supply Ratio (SSR) rose 1.04% to 11.2082, which can indicate reduced relative ‘buying power’ from stablecoin reserves compared with Bitcoin’s market capitalization. Net Unrealized Profit/Loss (NUPL) improved to 0.1690 (+1.10%) but remained low, implying the market is not heavily dominated by paper gains—often consistent with cautious positioning rather than exuberance.
Meanwhile, exchange-held Bitcoin increased to 2,719,083 BTC (+0.18%), and net exchange flows showed a net inflow of 4,788 BTC (+1.52%). Both metrics can be read as an uptick in readily sellable supply, potentially raising the risk of profit-taking during rebounds. Active wallet addresses were broadly steady but slightly lower at 458,571, indicating that on-chain activity has not meaningfully expanded alongside the price recovery.
Overall, the day’s move reflects a market attempting to stabilize after a volatile stretch: fear appears to be easing, but reduced volume and rising exchange inflows suggest traders are still wary. Whether Bitcoin can turn the rebound into a more durable uptrend will likely depend on renewed liquidity, stronger participation, and confirmation from medium-term technical signals.
🔎 Market Interpretation
- Price rebound, but conviction looks thin: BTC recovered to $64,784 (+3.71%), yet the move is occurring alongside lower spot volume, framing it as a stabilization attempt rather than a confirmed reversal.
- Classic “price up, volume down” setup: Spot volume fell to $28.93B (-15.79%), often signaling a rally driven by fewer participants and more vulnerable to fading without new buyers/liquidity.
- Volatility remains elevated: The last several sessions show alternating declines and rebounds (notably +4.35% on July 14), indicating a market still fragile and headline-sensitive.
- Cross-asset tone mildly risk-on: S&P 500 up and gold down suggests a partial return of risk appetite, a short-term tailwind for BTC, but not sufficient alone to confirm a regime shift.
- Short-term momentum improves, medium-term trend still bearish: Daily MACD is positive (55.35), while weekly MACD remains deeply negative (-5,798.35), highlighting a tactical bounce inside a still-weak broader structure.
- Defensive crypto positioning persists: BTC dominance rose to 58.46%, consistent with investors favoring “higher-quality” crypto exposure during uncertainty.
- Fear is easing, but still extreme: Fear & Greed at 25 remains in extreme fear, though improving—suggesting sentiment is thawing from panic rather than flipping bullish.
💡 Strategic Points
- Watch for liquidity confirmation: A more durable uptrend typically needs evidence of fresh buying power (e.g., stablecoin deployment) and rising volume accompanying price gains.
- Exchange inflows are a near-term risk factor: Exchange-held BTC rose to 2,719,083 and net flows showed +4,788 BTC inflow—often interpreted as increased readily sellable supply and higher probability of profit-taking during rebounds.
- Stablecoin “ammo” looks relatively weaker: SSR increased to 11.2082, implying stablecoin reserves are smaller relative to BTC market value—potentially limiting the market’s ability to sustain upside without new capital.
- Profit conditions remain muted: NUPL improved to 0.1690 but stays low, aligning with cautious positioning (less exuberant, but also less forced selling from overcrowded profits).
- Participation is not expanding yet: Google Trends fell (55 → 45) and active addresses dipped to 458,571, suggesting the bounce hasn’t pulled in broader retail/on-chain engagement—often needed for follow-through.
- Practical decision framework: Bulls typically want (1) volume expansion, (2) reduced exchange inflows or net outflows, and (3) improving medium-term indicators (weekly trend confirmation). Without these, rebounds can remain tradable but structurally fragile.
📘 Glossary
- Spot Trading Volume: Total value of BTC traded on spot markets in a period; rising volume during price increases often signals stronger demand.
- Liquidity Inflow: New capital entering markets (often via stablecoins or fresh risk appetite), supporting sustained buying pressure.
- Risk-on / Risk-off: Investor shift toward higher-risk assets (risk-on) versus safer assets like bonds/gold (risk-off).
- MACD (Moving Average Convergence Divergence): Momentum indicator; positive/turning up can suggest improving trend, while negative/declining suggests weakness. Daily vs weekly reflects short- vs medium-term conditions.
- BTC Dominance: Bitcoin’s share of total crypto market capitalization; rising dominance often indicates defensive positioning away from altcoins.
- Fear & Greed Index: Sentiment gauge; low values (like 25) indicate fear, which can coincide with capitulation phases or cautious conditions.
- Google Trends Interest: Proxy for retail/public attention; sustained bull phases often coincide with rising search interest.
- SSR (Stablecoin Supply Ratio): Compares BTC market cap to stablecoin supply; higher SSR can imply less stablecoin buying power relative to BTC valuation.
- NUPL (Net Unrealized Profit/Loss): On-chain metric showing whether holders are mostly in profit or loss; low/neutral levels suggest limited exuberance.
- Exchange-held BTC / Net Exchange Flows: BTC held on exchanges and net movement in/out; inflows can raise sell-pressure risk, outflows can suggest holding/accumulation.
- Active Addresses: Number of unique addresses active on-chain; helps gauge participation and network usage.



















Comment 0