 News
News  Coin Information
  About us
  Customer Service


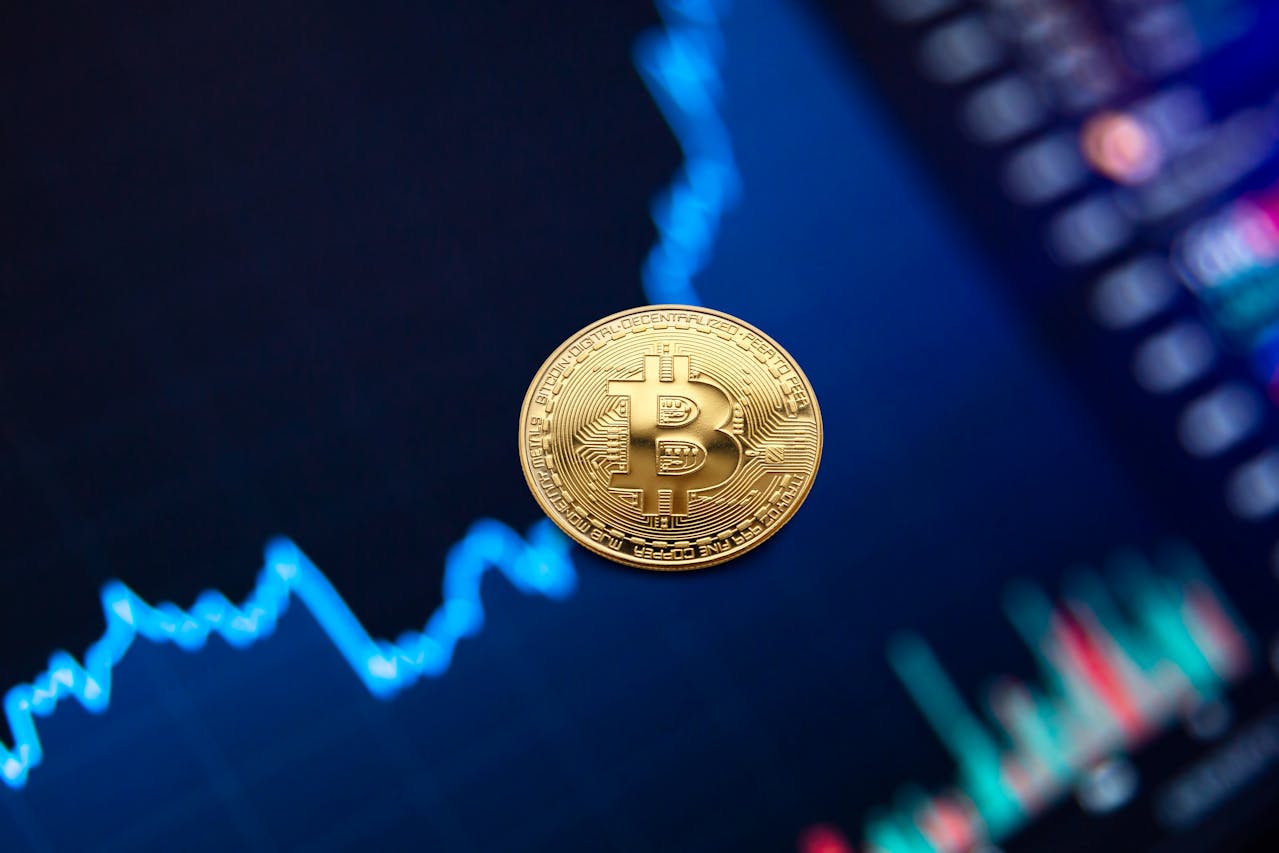
The cryptocurrency market is in chaos, and few truly understand what’s happening. While some urge investors to "buy the dip," others warn that we are deep in a bear market, signaling an urgent exit. Instead of speculating, it's wise to analyze key indicators like Bollinger Bands.
Developed by legendary trader John Bollinger, this indicator consists of a 23-day moving average with upper and lower bands marking price volatility. On the daily timeframe, Bitcoin has been trading below the middle band since late January, failing to regain upward momentum.
Recently, BTC touched the lower band at $81,500 before bouncing back. However, despite this recovery, the critical middle curve remains untested at $92,200. Historically, Bitcoin struggles to break this level during bearish phases. Even major announcements—such as BTC's inclusion in the U.S. Strategic Reserve—failed to drive prices past this resistance.
Currently trading at $90,700, Bitcoin appears to be approaching its upper resistance. If the price fails to breach $92,200, we may see renewed downward pressure. Traders should closely monitor this range, as a breakout or rejection at this level could determine Bitcoin’s next major move.
While predicting the market is tricky, reacting to reliable indicators remains the best strategy in uncertain times.


Comment 0