 News
News  Coin Information
  About us
  Customer Service


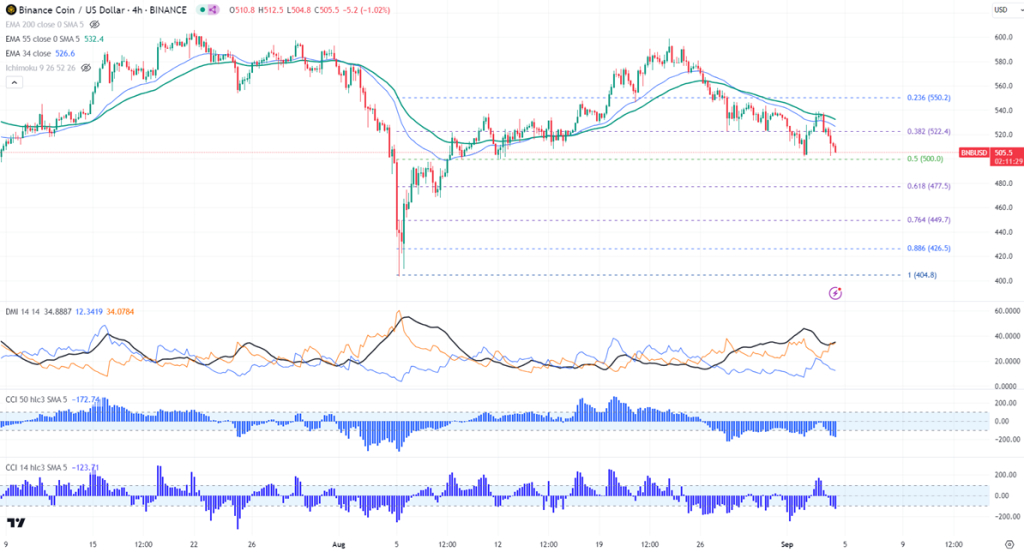
Intraday bias - Bearish
Horizontal trend line- $605
Any close above $555 confirms intraday bullishness.
BNBUSD pared some of its gains after a minor pullback..The pair struggles to close above the short-term 34 and below 55 EMA and long-term moving average in the 4-hour chart. It hit a high of $538.70 yesterday and is currently trading around $505.70.
The bullish invalidation can happen if the pair closes below $403 (Aug 5th low). On the lower side, the near-term support is $500. Any violation below confirms bearish continuation. A dip to $477/$450/$403 is possible.
The immediate resistance stands at around $520. Any breach above confirms minor bullishness. A jump to $541/$553 is possible. Bullish continuation only if it breaks $553. A surge past $553 will take it to $605/$700.
Indicators ( 4- hour chart)
Directional movement index -Bearish
CCI (50)- Bearish
CCI(14)- Bullish
It is good to buy above $553 with SL around $519 for TP of $700.


Comment 0