 News
News  Coin Information
  About us
  Customer Service


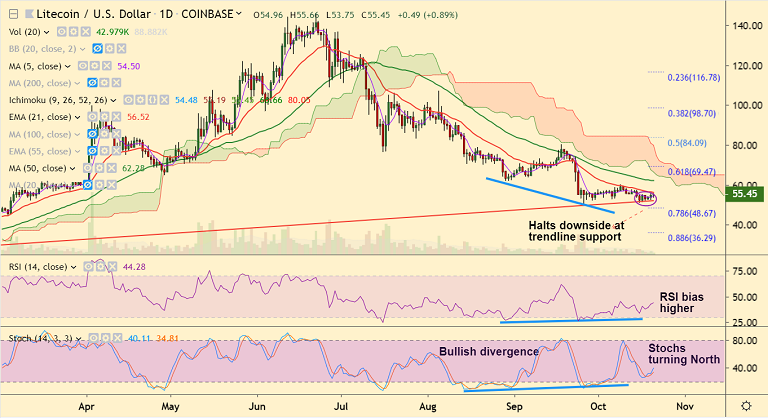
LTC/USD chart - Trading View
Exchange - Coinbase
Support: 55.29 (20-DMA); Resistance: 63.90 (55-EMA)
Technical Analysis: Bias Neutral
LTC/USD confined to narrow ranges, forms 'Doji' on the daily candle at the time of writing.
The pair was trading at 55.24 at 11:10 GMT, after hitting session highs at 55.78 and lows at 53.75.
Bullish divergence keeps scope for upside, Stochs and RSI are now biased higher.
Constriction of shorter-term moving averages seen on the GMMA indicator, shows possible shift in near-term trend.
Breakout above 21-EMA will support gains. Next hurdle on the upside lies at 50-DMA at 62.77.
5-DMA is immediate support at 54.46. Break below trendline support (52.25) negates upside bias.


Comment 0