 News
News  Coin Information
  About us
  Customer Service


ETH/USD chart - Trading View
Exchange - Coinbase
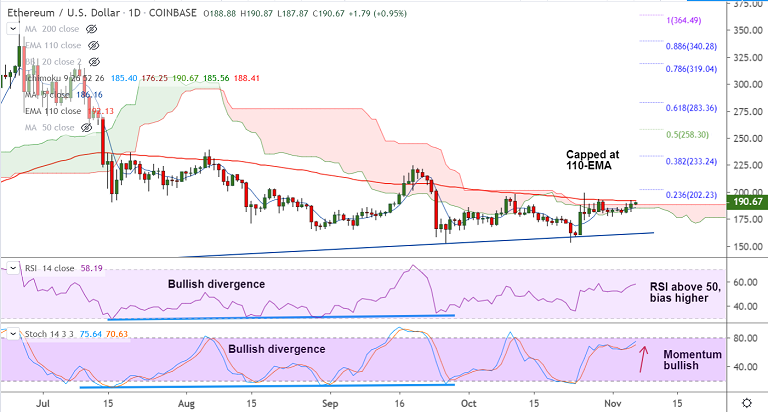
Support: 186.26 (5-DMA); Resistance: 192.13 (110-EMA)
Technical Analysis: Bias bullish
ETH/USD is extending gains for the 3rd straight session, trades 1.13% higher at 191.01 at 04:28 GMT.
The pair is trading with a slight bullish bias. Technical indicators are turning bullish.
RSI and Stochs are biased higher, RSI is above 50 with room to run further. Volatility is rising.
GMMA shows shift in the near-term trend with short-term MAs breaking above long-term MAs.
Upside finds stiff resistance at 110-EMA at 192.13. Break above will propel the pair higher.
Next major hurdle lies at 23.6% Fib at 202.23. Break above will take the pair to 200-DMA at 213.57.
On the flipside, 5-DMA is immediate support at 186.15. Break below 21-EMA negates near-term bullishness.


Comment 0