 News
News  Coin Information
  About us
  Customer Service


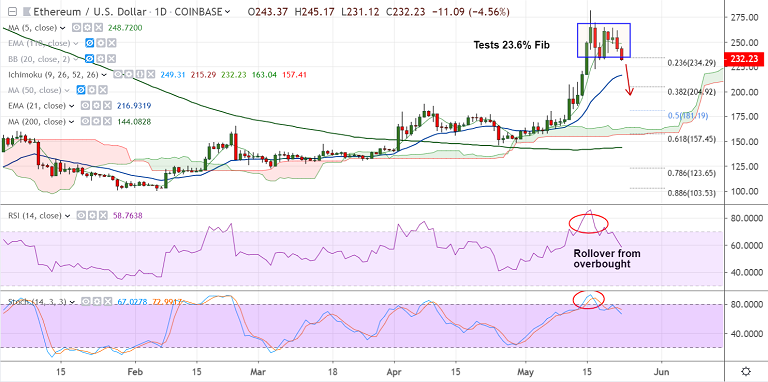
ETH/USD chart - Trading View
Exchange - Coinbase
Support: 216.96 (21-EMA); Resistance: 267.51 (Weekly cloud base)
Technical Analysis: Bias Neutral to Slightly Bearish
ETH/USD trades 3.56% lower on the day at 234.54 at 08:55 GMT.
The pair has broken below 1H 200-SMA and hovers around 23.6% Fib retracement at 234.
5-DMA is flat, Stochs and RSI are showing a rollover from overbought levels.
MACD is on verge of a bearish crossover on signal line and volatility is shrinking.
Break below 230 will see dip till 21-EMA at 217. Break below 21-EMA to see further downside.
On the flipside, the pair finds stiff resistance at weekly cloud, further upside only on break above.
For details on FxWirePro's Currency Strength Index, visit http://www.fxwirepro.com/currencyindex.


Comment 0