BTC/USD chart - Trading View
Exchange - Coinbase
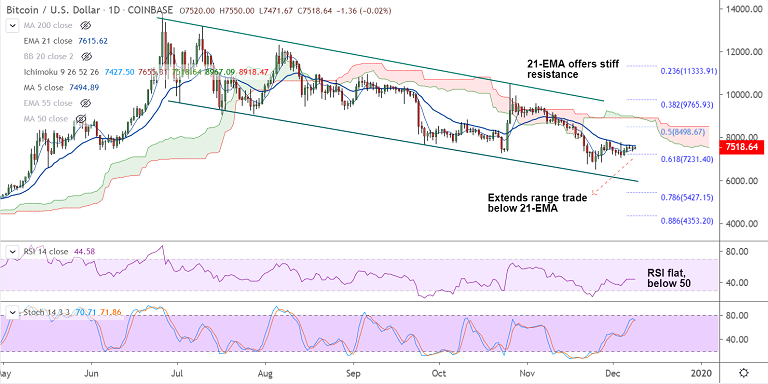
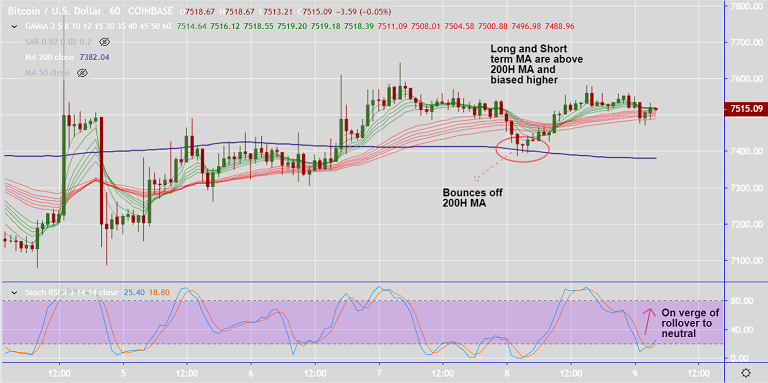
Support: 7382 (200H MA); Resistance: 7616 (21-EMA)
Technical Analysis: Bias turning bullish
BTC/USD has been trading rangebound in the Asian session, with session high at 7550 and low at 7471.
The pair finds stiff resistance at 21-EMA (7616) which is capping upside from many sessions.

Intraday bias is turning slightly bullish, price action is extending break above 200H MA (7382).
Pullbacks have bounced off 200H MA support and major and minor moving averages are above 200H MA.
A bullish 5-DMA crossover on 20-DMA on the daily charts keeps scope for gains. Break above 21-EMA opens upside.
Next major hurdle aligns at 55-EMA at 8109 ahead of 50-DMA at 8247. Bullish continuation only on channel breakout.
Major trend is bearish and rejection at 21-EMA will see resumption of weakness.


Comment 0