 News
News  Coin Information
  About us
  Customer Service


Ripple (XRP) is struggling to find a clear direction, extending a weak, range-bound slide as technical signals point to a market caught between fading downside momentum and a still-intact broader downtrend. Several leading AI models broadly agree that XRP is in a ‘counter-trend rebound attempt’ rather than the start of a sustained reversal, with the next move hinging on whether a key support band breaks.
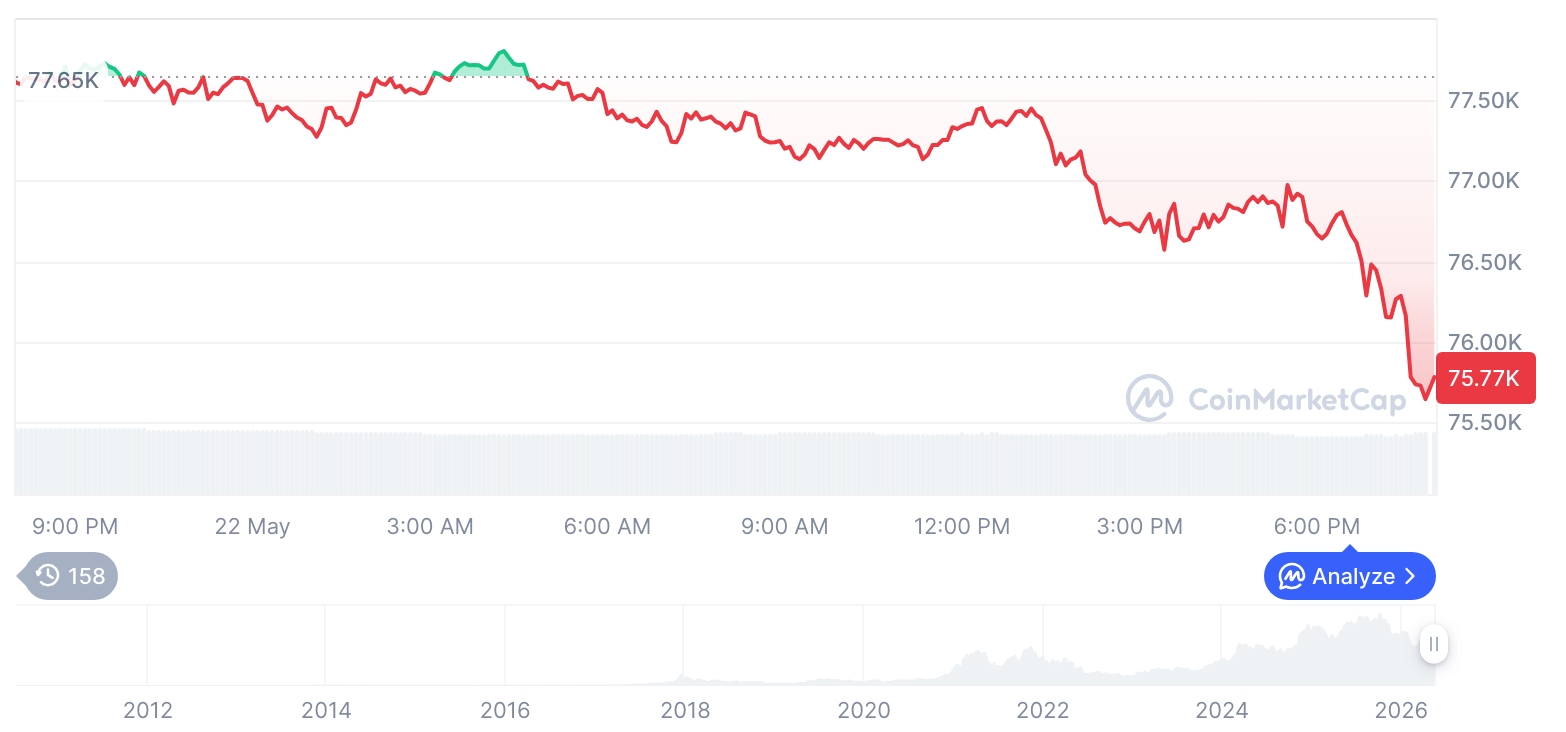
As of Saturday ET, XRP was trading around $1.33, well below its 200-day simple moving average near $1.68—an indicator many traders use to gauge long-term trend health. That gap underscores persistent ‘bearish structure’ on higher timeframes. At the same time, the relative strength index (RSI) has slipped to roughly 37, approaching levels commonly associated with oversold conditions and raising the odds of a short-term technical bounce.
The focal point for traders is the $1.31–$1.33 region. The zone aligns with a recent swing low and a widely watched Fibonacci retracement level (0.786), making it a de facto near-term ‘defense line’ for buyers. Holding above it could allow XRP to stabilize and attempt a rebound, while a decisive breakdown could accelerate losses as stop orders and momentum selling kick in.
According to a GPT-5.2-based assessment, the current tape resembles a ‘bear-market consolidation’ rather than a basing pattern. The model highlights XRP’s extended position below the 200-day average as evidence that the prevailing trend remains lower, but notes that falling RSI can coincide with crowded short positioning. In that setup, a push above $1.38 could trigger ‘short-covering’ and lift prices toward the $1.42–$1.45 area. On the downside, a sustained move below $1.31 was framed as opening room toward $1.28, with an extension toward $1.20 possible if selling pressure intensifies.
Claude Sonnet 4.6 also centered its outlook on the 0.786 Fibonacci area around $1.34, describing it as ‘critical support’ currently being tested. The model pointed to declining volume as a double-edged signal—potentially indicating seller exhaustion, but also suggesting dwindling market interest. Claude’s near-term path higher depends on reclaiming $1.35, which could set up a move toward $1.37 and then $1.42. However, it warned that a break of $1.31 could lead to a fast drop toward $1.28 and as low as $1.23 amid thin liquidity.
xAI 4.1 took a more cautious stance on momentum and flows. While acknowledging RSI nearing oversold territory, it argued there are not yet strong confirmation signals of a reversal, emphasizing that price remains pinned below longer-term moving averages—a primary ‘bearish driver.’ Still, it observed signs of buying interest around $1.33 that could support a reflexive bounce. In that scenario, a break above $1.40 could allow a climb toward $1.43, but a slip below $1.33 would refocus attention on a retest of $1.30–$1.28.
Across the three views, the shared framework is largely the same: XRP appears to be entering an ‘oversold zone’ where a technical rebound is plausible, yet any upside is better understood as a move within a broader downtrend until key trend measures are reclaimed. In practical terms, the market is now boxed between $1.31 support and roughly $1.38 resistance—levels that may determine whether the next 24 hours bring a rebound attempt, a breakdown, or a continuation of sideways trade.
Analysts outlined three near-term scenarios. First, if $1.31 holds, XRP could probe $1.38 and, if cleared, rebound toward the low-$1.40s. Second, if support fails, the decline could extend toward $1.28 and potentially into the $1.20 area as bearish momentum builds. Third, if XRP remains trapped between $1.31 and $1.38, it may signal a ‘volatility compression’ phase in which the market consolidates before a sharper move.
The models presented similar probability-weighted expectations for a bounce, each pegging the rebound likelihood at about 42%, with upside targets clustered around $1.42–$1.45 and downside risk generally framed toward $1.28–$1.30, with deeper levels possible if the selloff accelerates.
Market participants note, however, that technical tools such as RSI, long-term moving averages, and Fibonacci retracement levels are probabilistic and backward-looking. Crypto prices can be heavily influenced by external catalysts—including macroeconomic data, liquidity conditions, and shifts in risk sentiment—factors that can overwhelm chart-based setups and extend volatility beyond model projections.
🔎 Market Interpretation
- Trend context: XRP (~$1.33) remains below the 200-day SMA (~$1.68), reinforcing a broader bearish structure despite potential short-term stabilization.
- Momentum setup: RSI ~37 signals the market is nearing an oversold zone, increasing the odds of a technical bounce—but not yet confirming a trend reversal.
- Key battleground: The $1.31–$1.33 band (recent swing low + 0.786 Fibonacci retracement) is the near-term “line in the sand.” Holding it favors consolidation/bounce; losing it risks a faster selloff.
- Range to watch (24h focus): Market is boxed between $1.31 support and ~$1.38 resistance; a break likely decides the next directional move.
- AI consensus framing: GPT-5.2, Claude Sonnet 4.6, and xAI 4.1 broadly label current action as a counter-trend rebound attempt / bear-market consolidation rather than a durable bottom.
- Probability lens: Models cluster around ~42% chance of a rebound, with upside targets $1.42–$1.45 and downside focus $1.28–$1.30 (deeper risk if selling accelerates).
- Risk caveat: Technical signals are probabilistic and backward-looking; macro data, liquidity shifts, and sentiment shocks can override chart setups.
💡 Strategic Points
- Support defense (bull case): If price holds above $1.31–$1.33, traders may look for stabilization and a push into $1.35–$1.38.
- Confirmation trigger: A reclaim of $1.38 (and/or $1.40 per xAI) strengthens the bounce thesis; potential follow-through targets cluster near $1.42–$1.45.
- Short-covering catalyst: GPT-5.2 notes that weak RSI can coincide with crowded shorts; a move above ~$1.38 could fuel a short squeeze toward the low-$1.40s.
- Breakdown roadmap (bear case): A decisive break below $1.31 raises odds of acceleration to $1.30–$1.28, with extension risks toward $1.23–$1.20 if liquidity thins and momentum selling expands.
- Sideways outcome: Persistence between $1.31 and $1.38 implies volatility compression—often preceding a sharper move; watch for expansion in volume and range as confirmation.
- Volume read-through: Declining volume can mean seller exhaustion or reduced participation; directional conviction improves if a breakout/breakdown occurs with stronger volume.
- Trend-validation metric: Even if a bounce occurs, the broader downtrend remains the default until XRP meaningfully reclaims major trend gauges (notably the 200-day SMA).
📘 Glossary
- 200-day Simple Moving Average (200D SMA): The average closing price over 200 days; often treated as a proxy for the long-term trend. Trading below it frequently signals bearish conditions.
- Relative Strength Index (RSI): A momentum oscillator (0–100). Readings below ~30 are commonly considered oversold; ~37 suggests weakening momentum but not necessarily a reversal.
- Fibonacci Retracement (0.786): A technical level derived from Fibonacci ratios; the 0.786 retracement is often watched as a potential support/resistance zone in pullbacks.
- Swing Low: A local price trough that can act as support; repeated tests increase its importance.
- Bear-market consolidation: Sideways trading that occurs within a larger downtrend, often before the next directional leg lower or a counter-trend rally.
- Counter-trend rebound: A short-term rally against the prevailing trend; may fail if major resistance/trend measures are not reclaimed.
- Short-covering: When traders who sold short buy back to exit positions, potentially accelerating upside moves.
- Stop orders / momentum selling: Automated exits and trend-following selling that can amplify declines once key support breaks.
- Thin liquidity: Fewer orders in the market, which can increase slippage and make price moves sharper and faster.
- Volatility compression: A period of narrowing price range that often precedes a breakout (up or down).


Comment 0