

 News
News  Coin Information
  About us
  Customer Service


Roughly $79.58 million in leveraged crypto positions were liquidated over the past 24 hours, underscoring how fragile derivatives positioning remains even as spot prices show only modest movement. The latest data suggests traders are being forced to unwind exposure amid choppy, rotation-driven volatility rather than a clear market-wide trend.
According to CoinGlass figures compiled over the period, aggregated liquidations totaled about $4.0 million on long positions and approximately $39.58 million on short positions, though the dataset appears to mix reporting standards across exchanges and asset categories. That discrepancy means the true market-wide liquidation total could be higher than the headline figure, a common issue when venues differ in how they classify contract types and liquidation events.
In the most recent four-hour window, exchange-reported liquidations reached $9.61 million. Binance led the tally with $5.30 million—about 55.19% of the total—while long liquidations accounted for $3.38 million, or 63.79% of the venue’s total. OKX followed with $1.23 million in liquidations and a similar long-heavy split (63.2%). Bybit recorded $1.02 million, with long liquidations making up an unusually high 84.42%, suggesting recent price action disproportionately caught leveraged bulls offside on that venue.
Smaller derivatives platforms showed even sharper skews. Aster posted $539,120 in liquidations with longs representing 91.78%, while Gate also reported a high long share at 85.34%. Hyperliquid stood out for its relatively even distribution: of $474,640 in liquidations, longs made up 52.99% and shorts 47.01%, hinting at a two-sided market where both directional bets were squeezed during rapid intraday swings.
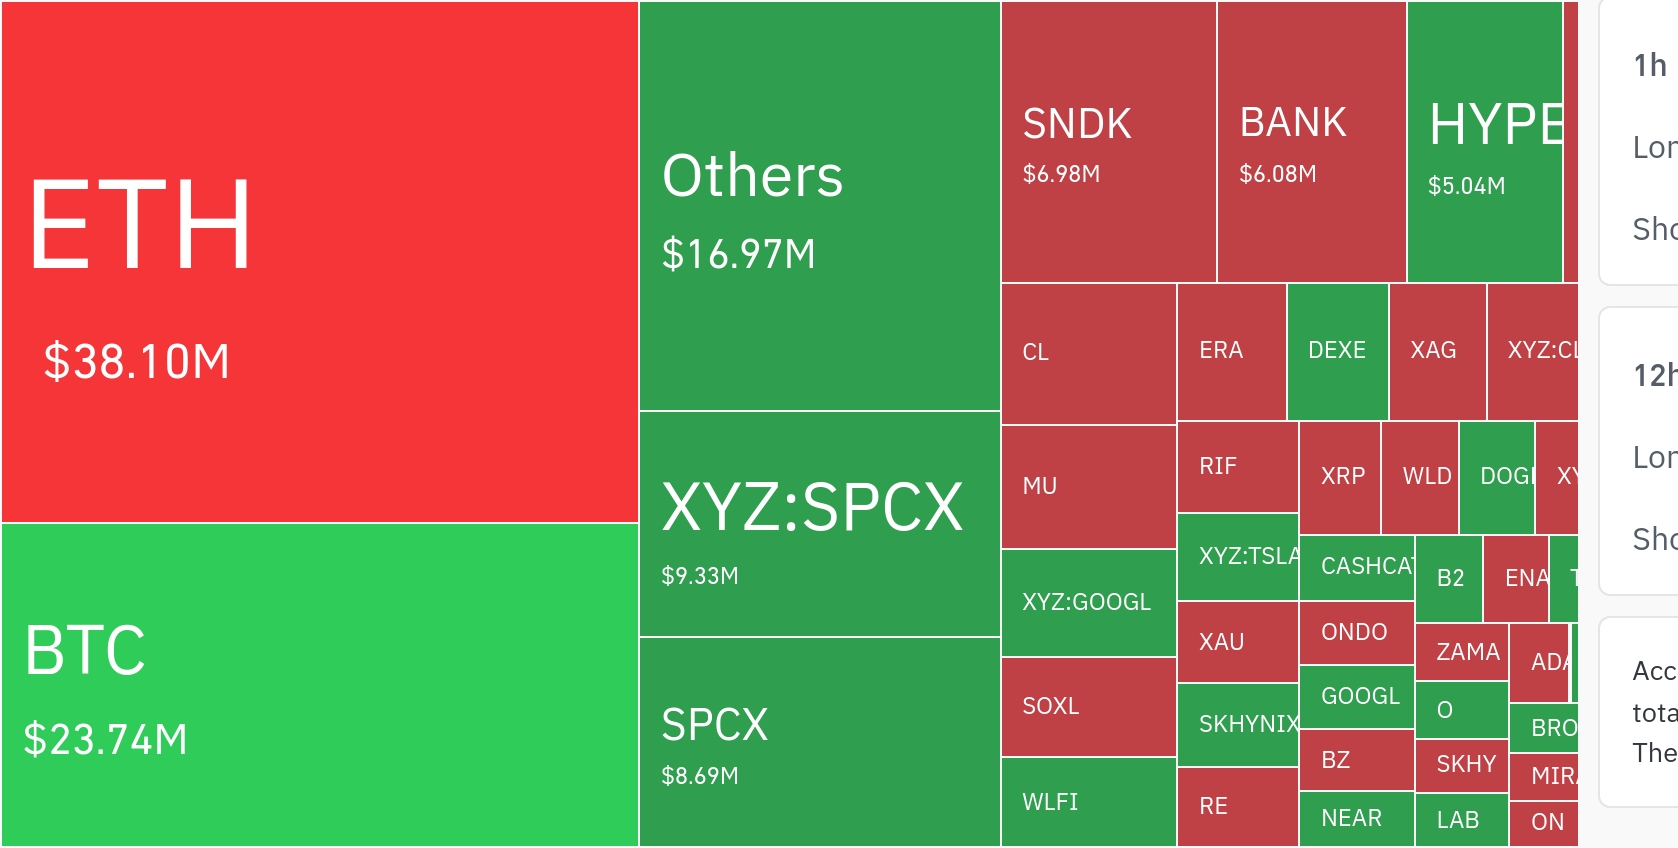
By asset, Ethereum (ETH) and Bitcoin (BTC) continued to dominate liquidation activity. CoinGlass’ 24-hour liquidation heatmap showed Ethereum at $38.10 million and Bitcoin at $23.74 million, far ahead of other major tokens. Yet the same period saw only limited spot movement, with Bitcoin up about 0.05% and Ethereum up roughly 0.17%, reinforcing the view that the shakeout was driven more by leverage and position crowding than by a decisive price break.
Additional ticker-level liquidation totals further illustrated the pattern. Bitcoin logged around $1.20 million in liquidations over 24 hours (roughly $638,500 longs and $563,700 shorts), while Ethereum saw about $1.73 million (around $873,400 longs and $854,200 shorts). The near-balance between long and short liquidations in the two largest crypto assets suggests the market was in a broad 'deleveraging' phase rather than a one-way squeeze.
Among large-cap altcoins, Dogecoin (DOGE) drew attention. Despite a 0.42% price rise over 24 hours, DOGE recorded about $1.06 million in liquidations, including roughly $829,000 in long liquidations and $232,400 in short liquidations, indicating significant forced position closures during the move. XRP showed a different dynamic: even as it slipped about 0.13%, short liquidations (around $806,500) exceeded long liquidations (about $367,200), pointing to aggressive short positioning that still struggled to weather intraday reversals. Solana (SOL) also dipped slightly (about 0.12%) while shorts liquidated more than longs—roughly $198,600 versus $82,700—another sign that positioning imbalances, not spot direction alone, were driving liquidation outcomes.
Several individual tokens saw especially pronounced leverage resets. HYPE showed modest short liquidations in the last four hours (around $2,700) compared with $115,800 in long liquidations, but the 24-hour picture was more two-sided, with approximately $396,000 in long liquidations and $451,000 in short liquidations. PEPE displayed a similarly uneven intraday profile: in the last four hours, long liquidations were around $170,700 versus $7,900 for shorts, while the 24-hour totals were closer to balanced—about $739,600 in longs and $644,700 in shorts.
The heatmap also indicated that liquidation intensity was not confined to major tokens. Several mid- and small-cap names—particularly assets labeled SPCX-related—showed outsized figures, including roughly $9.33 million for an SPCX-related asset, $8.69 million for SPCX, $6.98 million for SNDK, $6.08 million for BANK, and $5.04 million for HYPE. The concentration suggests volatility has been rotating into narrower pockets of the market, where thinner liquidity can amplify liquidation cascades.
One notable takeaway is the divergence between exchange-level and asset-level patterns. While the last four hours of exchange data skewed heavily toward long liquidations across many venues, Bitcoin and Ethereum’s 24-hour figures were comparatively balanced between long and short liquidations. That mix is consistent with a market clearing excessive leverage on both sides, rather than reacting to a single directional catalyst.
In derivatives markets, 'liquidation' refers to the forced closure of a margin or futures position when a trader can no longer meet collateral requirements. Periods of elevated liquidations often coincide with sudden swings in funding rates, open interest, and order-book depth—factors that can intensify volatility even when headline spot prices appear stable.
For the broader market, the latest data signals a continued transition toward re-risking and repositioning rather than a clean breakout. With liquidation hotspots spreading beyond Bitcoin and Ethereum into select altcoins, traders may be watching whether leverage rebuilds quickly—raising the odds of another cascade—or continues to unwind in a more orderly fashion as liquidity conditions evolve.
🔎 Market Interpretation
- $79.58M liquidated in 24h despite minimal spot moves (BTC +0.05%, ETH +0.17%), signaling a leverage-driven shakeout rather than a trend breakout.
- CoinGlass aggregation shows short liquidations (~$39.58M) exceeding longs (~$4.0M), but the article flags cross-exchange reporting inconsistencies, implying the true total may differ.
- In the latest 4-hour window ($9.61M), liquidations skewed long-heavy on several venues (e.g., Bybit long share ~84%), suggesting leveraged bulls were caught on intraday whipsaws.
- BTC and ETH dominate the 24h heatmap (ETH ~$38.10M, BTC ~$23.74M), yet their long/short liquidation mix is relatively balanced—consistent with two-sided deleveraging.
- Rotation into thinner-liquidity pockets (SPCX-related names, SNDK, BANK, HYPE) hints at localized liquidation cascades where price impact is amplified.
- The key divergence: exchange-level data (recently long-skewed) vs. asset-level majors (more balanced) implies choppy, position-crowding volatility rather than a single catalyst.
💡 Strategic Points
- Assume choppiness, manage leverage: When spot is flat but liquidations spike, risk is often concentrated in derivatives positioning. Consider reducing leverage, widening liquidation buffers, or using smaller size.
- Watch venue-specific positioning: Heavy long-liquidation shares on certain exchanges (e.g., Bybit/Aster/Gate) can indicate crowded directional bets and higher risk of follow-through flushes on that venue.
- Track “deleveraging confirmation” metrics: Combine liquidation tapes with open interest changes, funding rate swings, and order-book depth to distinguish a one-off spike from a continuing unwind.
- Be cautious in small/mid-caps: The concentration in SPCX-related and other smaller tokens suggests liquidity is thin; avoid tight stops near obvious levels and expect gap-like moves during cascades.
- Interpret balanced BTC/ETH liquidations as “range regime”: Near-even long/short wipeouts often accompany mean-reverting conditions where both sides get squeezed during rapid swings.
- Prepare for either scenario: If leverage rebuilds quickly, cascade risk rises again; if OI and funding normalize, conditions may shift toward a more orderly market with cleaner signals.
📘 Glossary
- Liquidation: Forced closure of a leveraged position when margin/collateral falls below maintenance requirements.
- Long / Short: Longs profit if price rises; shorts profit if price falls. Either side can be liquidated during adverse moves.
- Derivatives positioning: Exposure via futures/perpetuals/options rather than spot holdings; typically higher leverage and faster risk transmission.
- Funding rate: Periodic payment between longs and shorts in perpetual swaps; extreme funding can signal crowded positioning.
- Open interest (OI): Total outstanding derivatives contracts; falling OI alongside liquidations often indicates deleveraging.
- Order-book depth: Available buy/sell liquidity near the current price; thinner depth increases slippage and cascade risk.
- Heatmap (liquidations): Visualization of liquidation totals by asset/time; highlights where forced unwinds are concentrated.
- Rotation-driven volatility: Choppiness caused by capital shifting between tokens/sectors rather than a broad market trend.















Comment 0