 News
News  Coin Information
  About us
  Customer Service


XLM/USD chart - Trading View
Exchange - Kraken
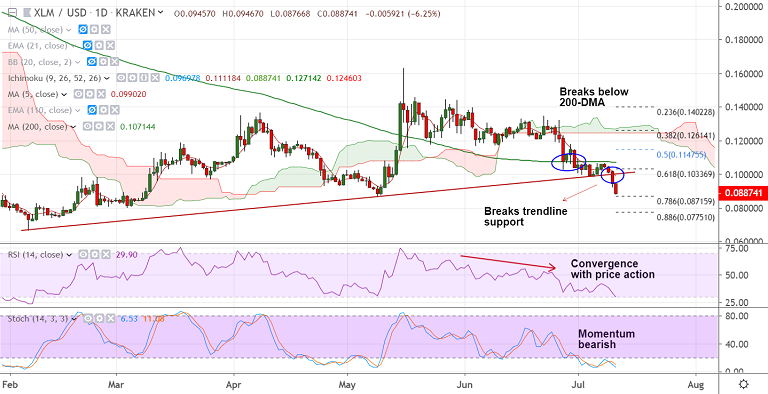
Support: 0.0862 (May 9 low); Resistance: 0.0991 (5-DMA)
Technical Analysis: Bias Bearish
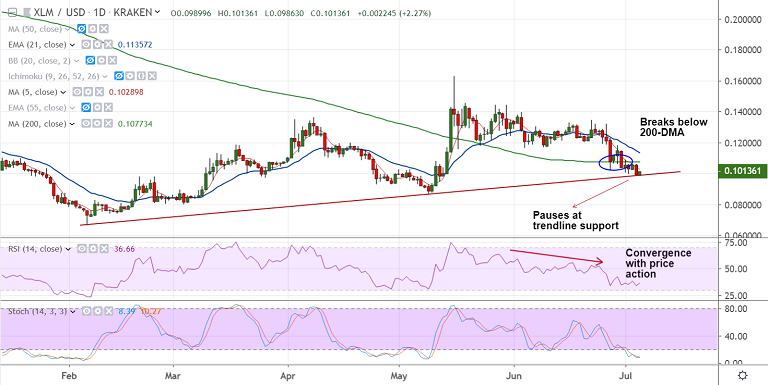
XLM/USD has broken strong trendline support, bias is strongly bearish.
The pair has hit 9-week lows at 0.0876, and is currently trading at 0.0893 at 07:20 GMT.
Technical analysis shows further weakness in the pair. Price action extending weakness below 200-DMA.
Volatility is rising and RSI nicely converging with price action. ADX is rising in support of downside.
Markets look forward to Stellar's Meridian Conference event scheduled in Nov for cues to boost value.
For now, bears eye 0.08 (Mar 2019 low). Further weakness will see test of 0.0775 (88.6% Fib).
Immediate resistance is seen at 5-DMA at 0.0990. Break above 200-DMA required for upside continuation.
For details on FxWirePro's Currency Strength Index, visit http://www.fxwirepro.com/currencyindex.


Comment 75