 News
News  Coin Information
  About us
  Customer Service


LTC/USD chart - Trading View
Exchange - Coinbase
Technical Analysis: Bias Bullish
GMMA Indicator: Major Trend - Turning slightly bullish; Minor Trend - Strongly bullish
Overbought/ Oversold Index: Overbought
Volatility: Rising
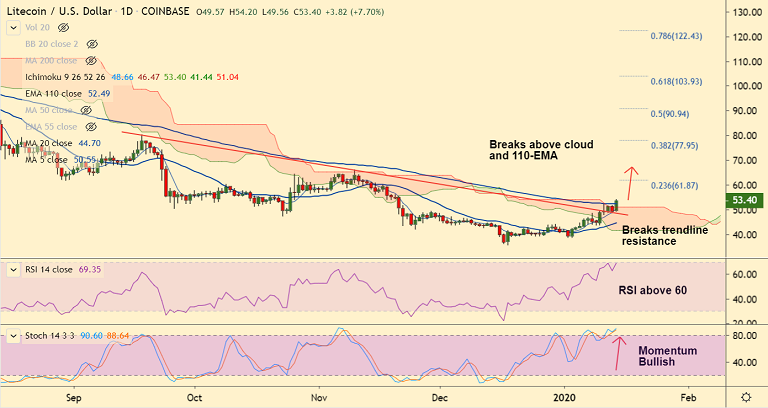
Support: 52.49 (110-EMA); Resistance: 54.37 (20W MA)
LTC/USD was trading 7.91% higher on the day at 53.50 at 07:00 GMT, bias has turned bullish.
The pair closed 3.58% lower on Monday's trade, but has gained upside momentum on the day, tracking BTC higher.
Price action has broken past major resistance levels - 48.75 (trendline), 51.04 (cloud top) and 52.49 (110-EMA).
Volatility is rising and GMMA shows bullish shift in the near-term trend. Technical indicators are also bias higher. Scope for continuation on upside momentum.
The pair finds major resistance at 20W MA at 54.37. Close above raises scope for test of 23.6% Fib at 61.87 ahead of 200-DMA at 66.42.
Failure at 20W MA will likely see sideways grind. Retrace below 21-EMA will negate any bullish bias.


Comment 2