 News
News  Coin Information
  About us
  Customer Service


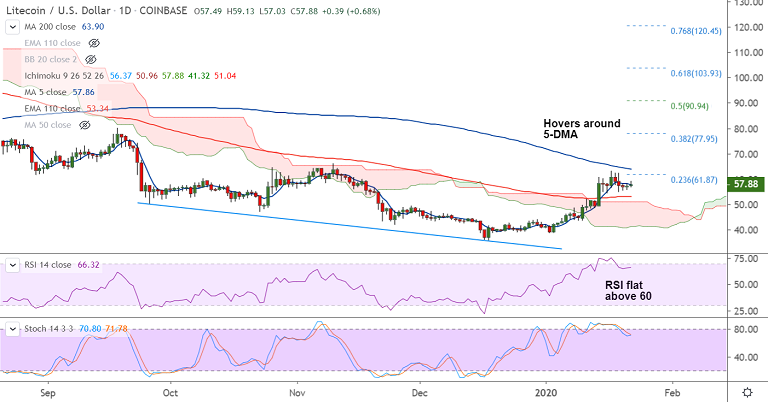
LTC/USD chart - Trading View
Exchange - Coinbase
Technical Analysis: Bias Bullish
GMMA Indicator: Major Trend - Bullish; Minor Trend - Bullish
Overbought/ Oversold Index: Neural
Volatility: Shrinking
Support: 52.71 (21-EMA); Resistance: 63.90 (200-DMA)
LTC/USD was trading 1.03% higher at 58.08 at around 09:50 GMT, bias is bullish.
The pair has retraced brief dip below 200H MA, scope for upside resumption.
Price action holds above daily cloud and correction has paused above 110-EMA.
Momentum studies are bullish. Stochs and RSI have again turned bullish after minor correction from overbought levels.
Major and minor trend as evidenced by GMMA indicator are bullish and resumption of upside will see test of 200-DMA at 63.90.
110-EMA is strong support at 53.34. Breach below cloud will see bullish invalidation.


Comment 0