 News
News  Coin Information
  About us
  Customer Service


ETH/USD chart - Trading View
Exchange - Coinbase
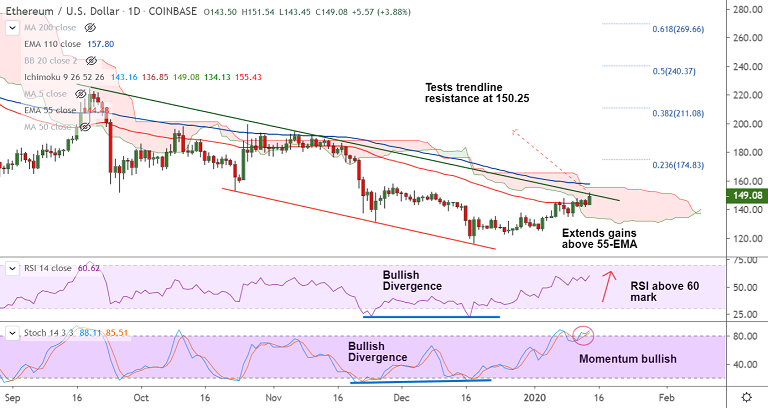
Technical Analysis: Bias Bullish
GMMA Indicator: Major Trend - Neutral; Minor Trend - Slightly bullish
Overbought/ Oversold Index: Overbought
Volatility: High and Rising
Support: 144.48 (55-EMA); Resistance: 155.43 (Cloud top)
ETH/USD was trading 3.99% higher on the day at 149.24 at 05:15 GMT, after closing 2.11% lower in the previous session.
The pair is extending break above 55-EMA and intraday bias has turned bullish.
Price action is testing major trendline resistance at 150.25 and decisive break above will propel the pair higher.
Volatility is rising, MACD supports upside. Positive DMI dominance added with rising ADX adds to the bullish bias.
Bullish divergence on RSI and Stochs along with strong bullish momentum supports further gains.
GMMA shows short-term MAs are on verge of break above long-term MAs, which if completed will boost further gains.
Breakout at trendline resistance finds next hurdle at cloud top at 155.43 ahead of 110-EMA at 157.81. Bullish continuation on break above.


Comment 0