 News
News  Coin Information
  About us
  Customer Service


ETH/USD chart - Trading View
Exchange - Coinbase
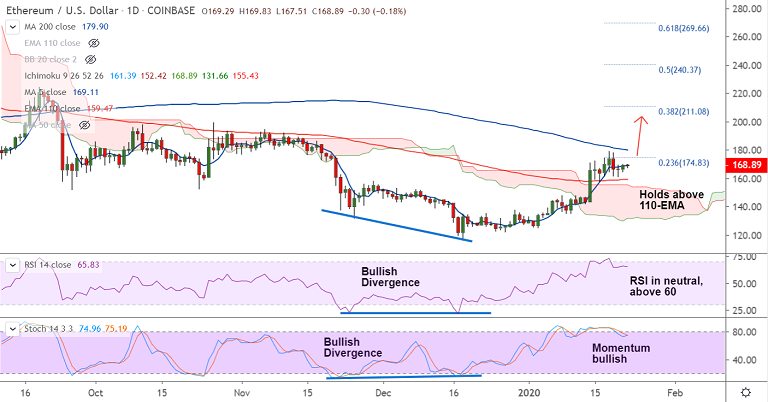
Technical Analysis: Bias Bullish
Support: 165.66 (200H MA); Resistance: 174.83 (23.6% Fib)
ETH/USD was trading largely unchanged on the day at 169.17 at around 06:40 GMT.
The pair has retraced from session lows at 167.51 and is set to resume previous session's gains.
Correction in the pair has stalled above 110-EMA support and technical indicators are biased higher.
Price action has bounced off 200H MA multiple times and weakness only on break below.
A 'Dragonfly Doji' formation on Mondays' candle dents downside. Major and minor trend in the pair has shown a shift higher.
Price action is capped between 110-EMA and 200-DMA. Breakout at 200-DMA will propel the pair higher.
Next bull target lies at 55W EMA at 197.84 ahead of 110W EMA at 209.59 and 38.2% Fib at 211.08.
On the flipside, breach at 200H MA will see test of 110-EMA at 159.47. Breach below 55-EMA (150.93) negates near-term bullish bias.


Comment 0