Exchange - Coinbase
Major Support Levels:
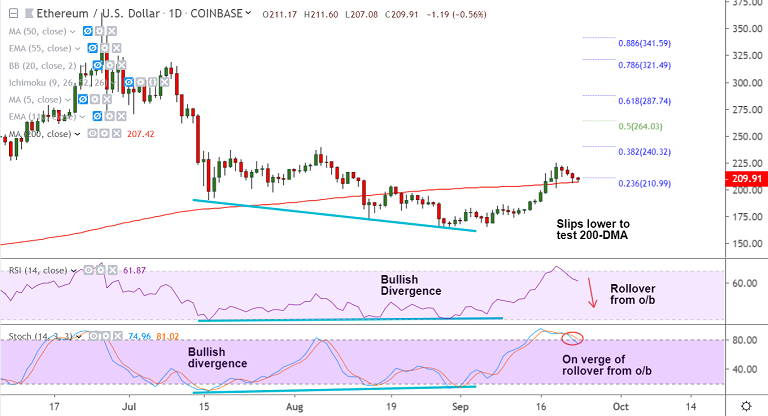
S1: 207.41 (200-DMA)
S2: 200.96 (55-EMA)
S3: 198.26 (21-EMA)
Major Resistance Levels:
R1: 214.80 (5-DMA)
R2: 226.75 (100-DMA)
R3: 240.2 (38.2% Fib)
Technical Chart:
ETH/USD chart - Trading View
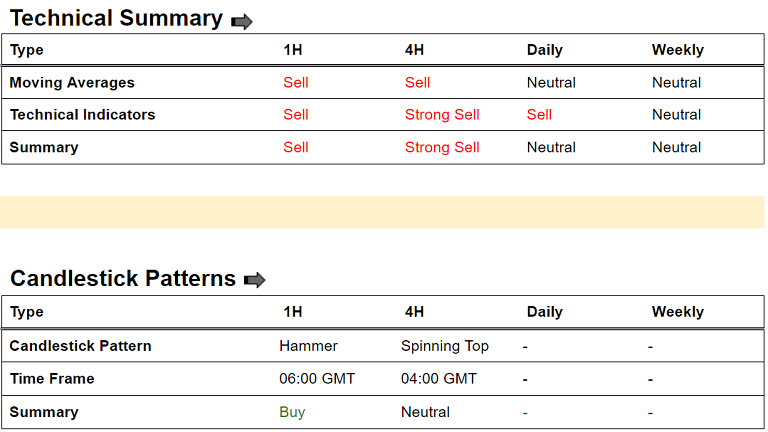
Summary: ETH/USD retraces from 6-week highs at 224.71 and is currently hovering around 200-DMA support at 207.41. Break below 200-DMA will see further weakness. Technical indicators on the intraday are turning bearish. Stochs and RSI are on verge of rollover from overbought levels. Major trend is bearish, break below 200-DMA will drag the pair lower. Bullish divergence could limit downside.
Guidance: Break below 200-DMA will see weakness, target-1: 200, target-2: 198.50.


