
 Add as a preferred source on Google
[BTC cycle tracker] Bitcoin tests $73,000 support as $75,800 resistance remains key
Bitcoin trades at $72,937 within weekly support at $72,700–$73,000. The weekly point of control at $75,800 remains key resistance, while its drawdown from the all-time high has widened to 42.13%.


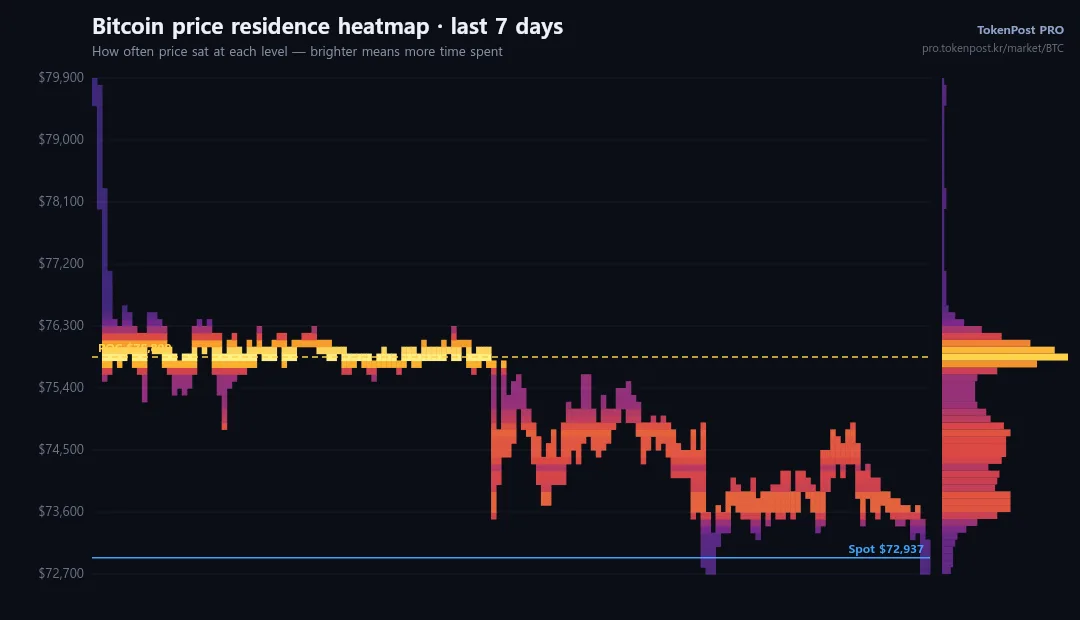
Bitcoin is testing weekly support at $72,700–$73,000, with the heaviest weekly price concentration at $75,800 marking a key resistance level.
Bitcoin trades at $72,937, within its lower weekly support band. The $75,800 point of control remains the main reference level above the market.
■ Weekly heatmap
As of November 12, the weekly price heatmap places the point of control (POC), the strongest price concentration, at $75,800. This marks the most concentrated price zone over the past week.
Bitcoin is trading below that level at $72,937. The weekly range spans $72,700–$79,900, with the current price near its lower boundary.
The upper resistance band runs from $75,700 to $76,100, with its peak at $75,800. This is the principal weekly concentration above the current price.
The lower support band lies between $72,700 and $73,000, with its strongest concentration at $72,800. Bitcoin currently trades within this band.
■ 24-hour heatmap
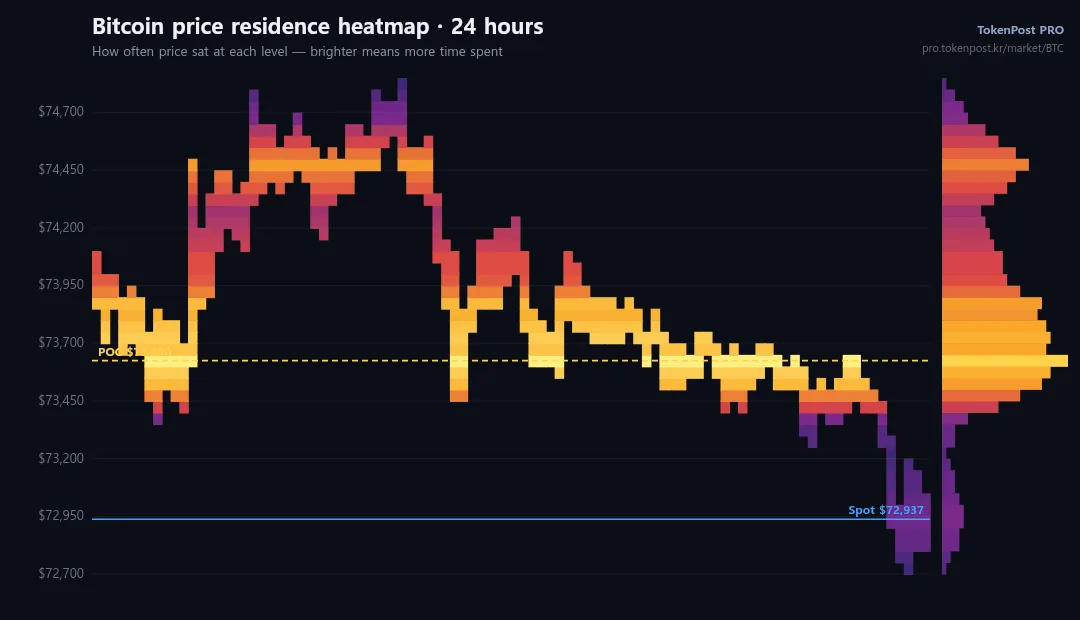
On the 24-hour heatmap, the strongest price concentration, or POC, stands at $73,600. This is the main concentration within the shorter trading window.
Bitcoin trades below that level at $72,937. The 24-hour range extends from $72,700 to $74,850.
The upper resistance band spans $73,450–$74,000, with its peak at $73,600. This marks the nearest resistance concentration above the current price.
The lower support band runs from $72,800 to $72,950, with its peak at $72,900. Bitcoin currently sits within this narrower support zone.
Bitcoin price heatmap, 24-hour view.
Drawdown from the high Bitcoin at $72,937 is 42.13% below its all-time high of $126,038, recorded on October 6, 2025. The decline has deepened from 39.63% seven days earlier, when the price stood at $76,088 on November 5, 2026.
Performance since the halving At 936 days after the halving, Bitcoin is up 14.23% from the halving price of $63,850. It continues to trade above that reference level.
Performance since the cycle low At 1,452 days after the cycle low of $15,770, Bitcoin is up approximately 363%. Despite the drawdown from its all-time high, it retains a substantial gain from the cycle low.
Riza Dagoc
Riza Dagoc reports on regulation, investing and the digital-asset business for TokenPost. Send corrections or tips to info@tokenpost.com.