
 Add as a preferred source on Google
Bitcoin tests support as cooling conditions put demand in focus
Bitcoin is retesting support after a roughly 10% pullback eased overheated conditions. Glassnode points to recent buyers’ profitability and sustained trading demand as key signals, while US spot ETFs continue to lose …


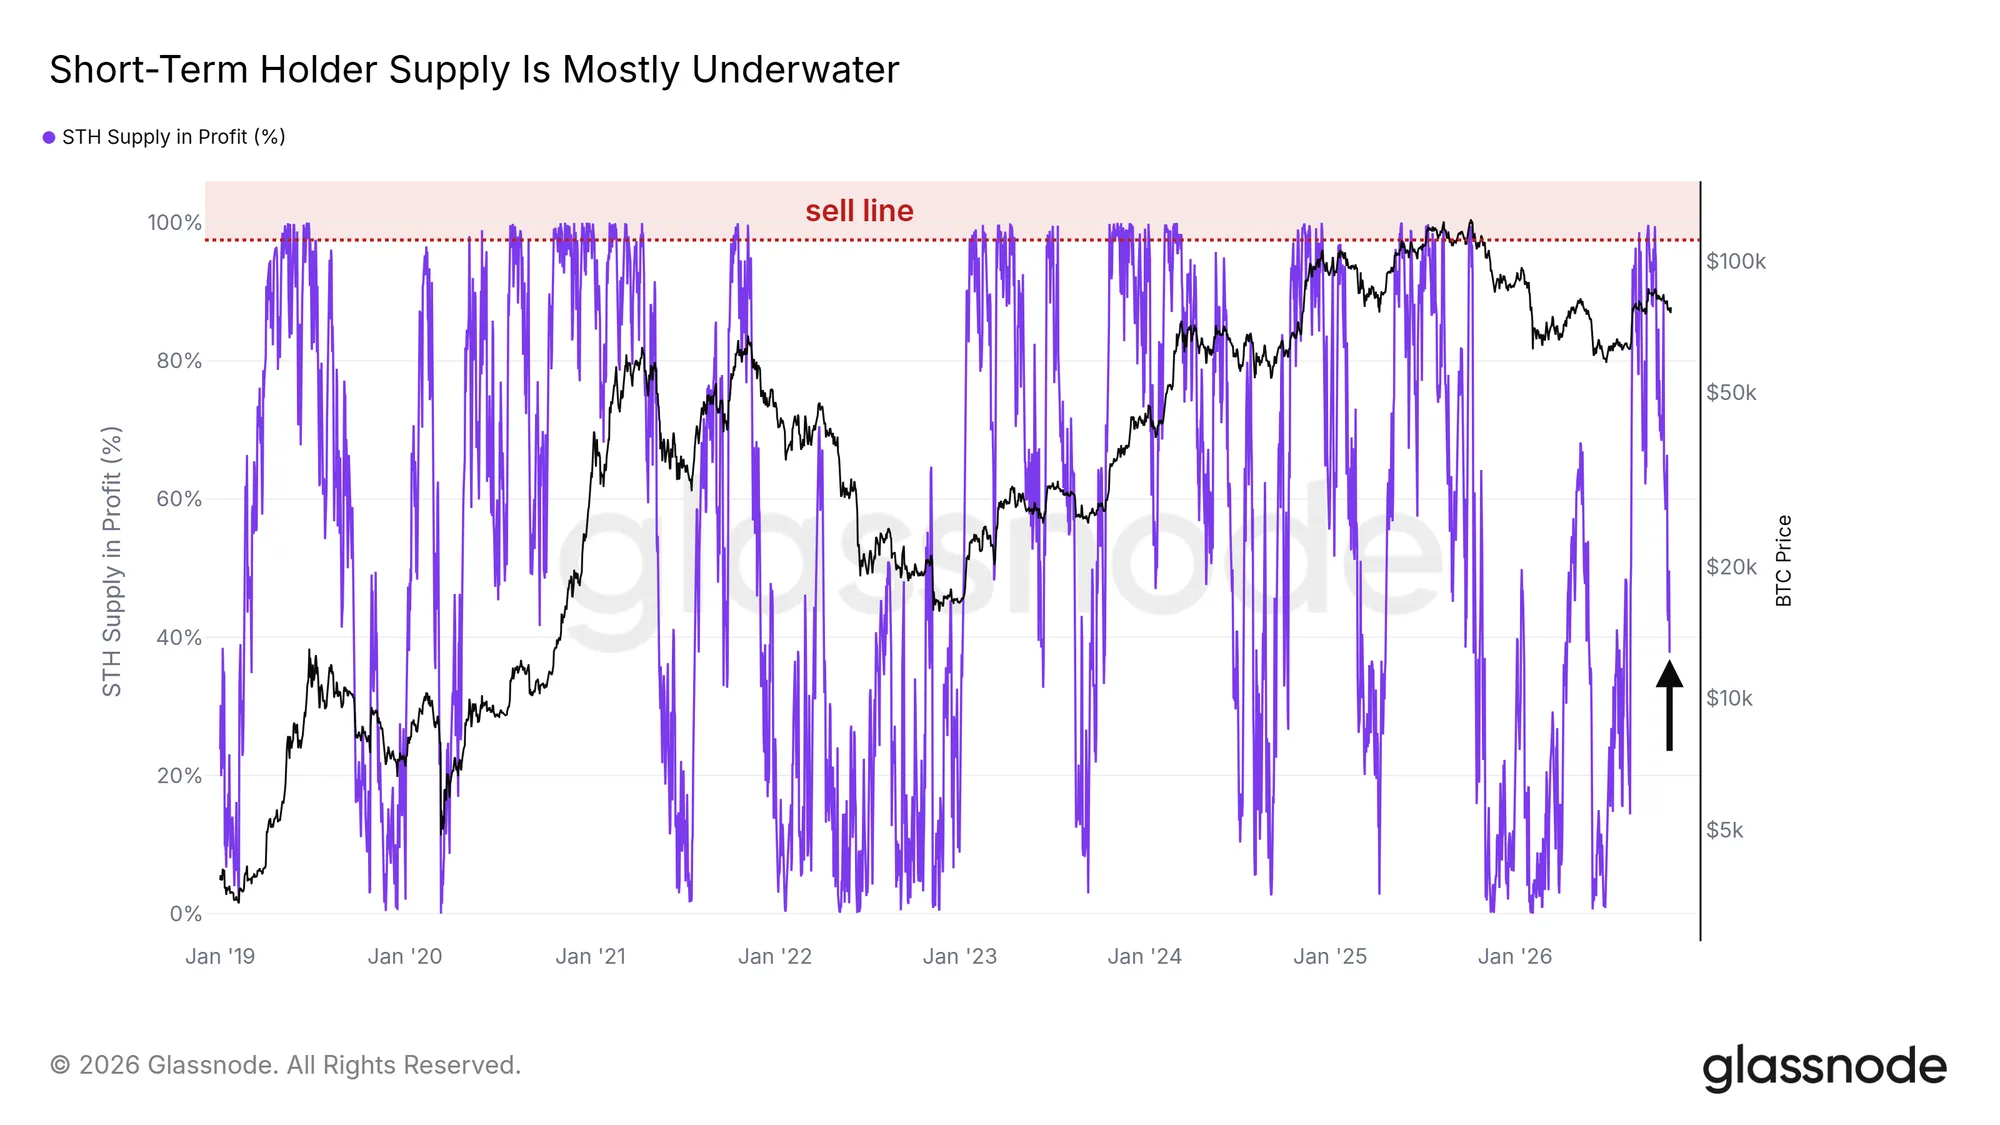
Bitcoin is testing whether key support levels can hold after a retreat eased overheated conditions. A recovery hinges on recent buyers returning to profit and trading demand holding up.
In its “Idling at Support” report published on November 4, 2026, Glassnode said almost all Bitcoin held by short-term holders was in profit in early October. These investors bought within the past 155 days. The share of their supply in profit stood at or above 97.5%, a zone the report describes as a sell line because nearly every recent buyer has gains available to realize.
After a roughly 10% decline from the September high, that share fell to about 38%, leaving most short-term holder supply at a loss. Glassnode said conditions were substantially less stretched than a month earlier. A recovery above 50% while price holds would indicate that newer buyers were returning to profit and regaining confidence.
Reclaimed levels face a support test
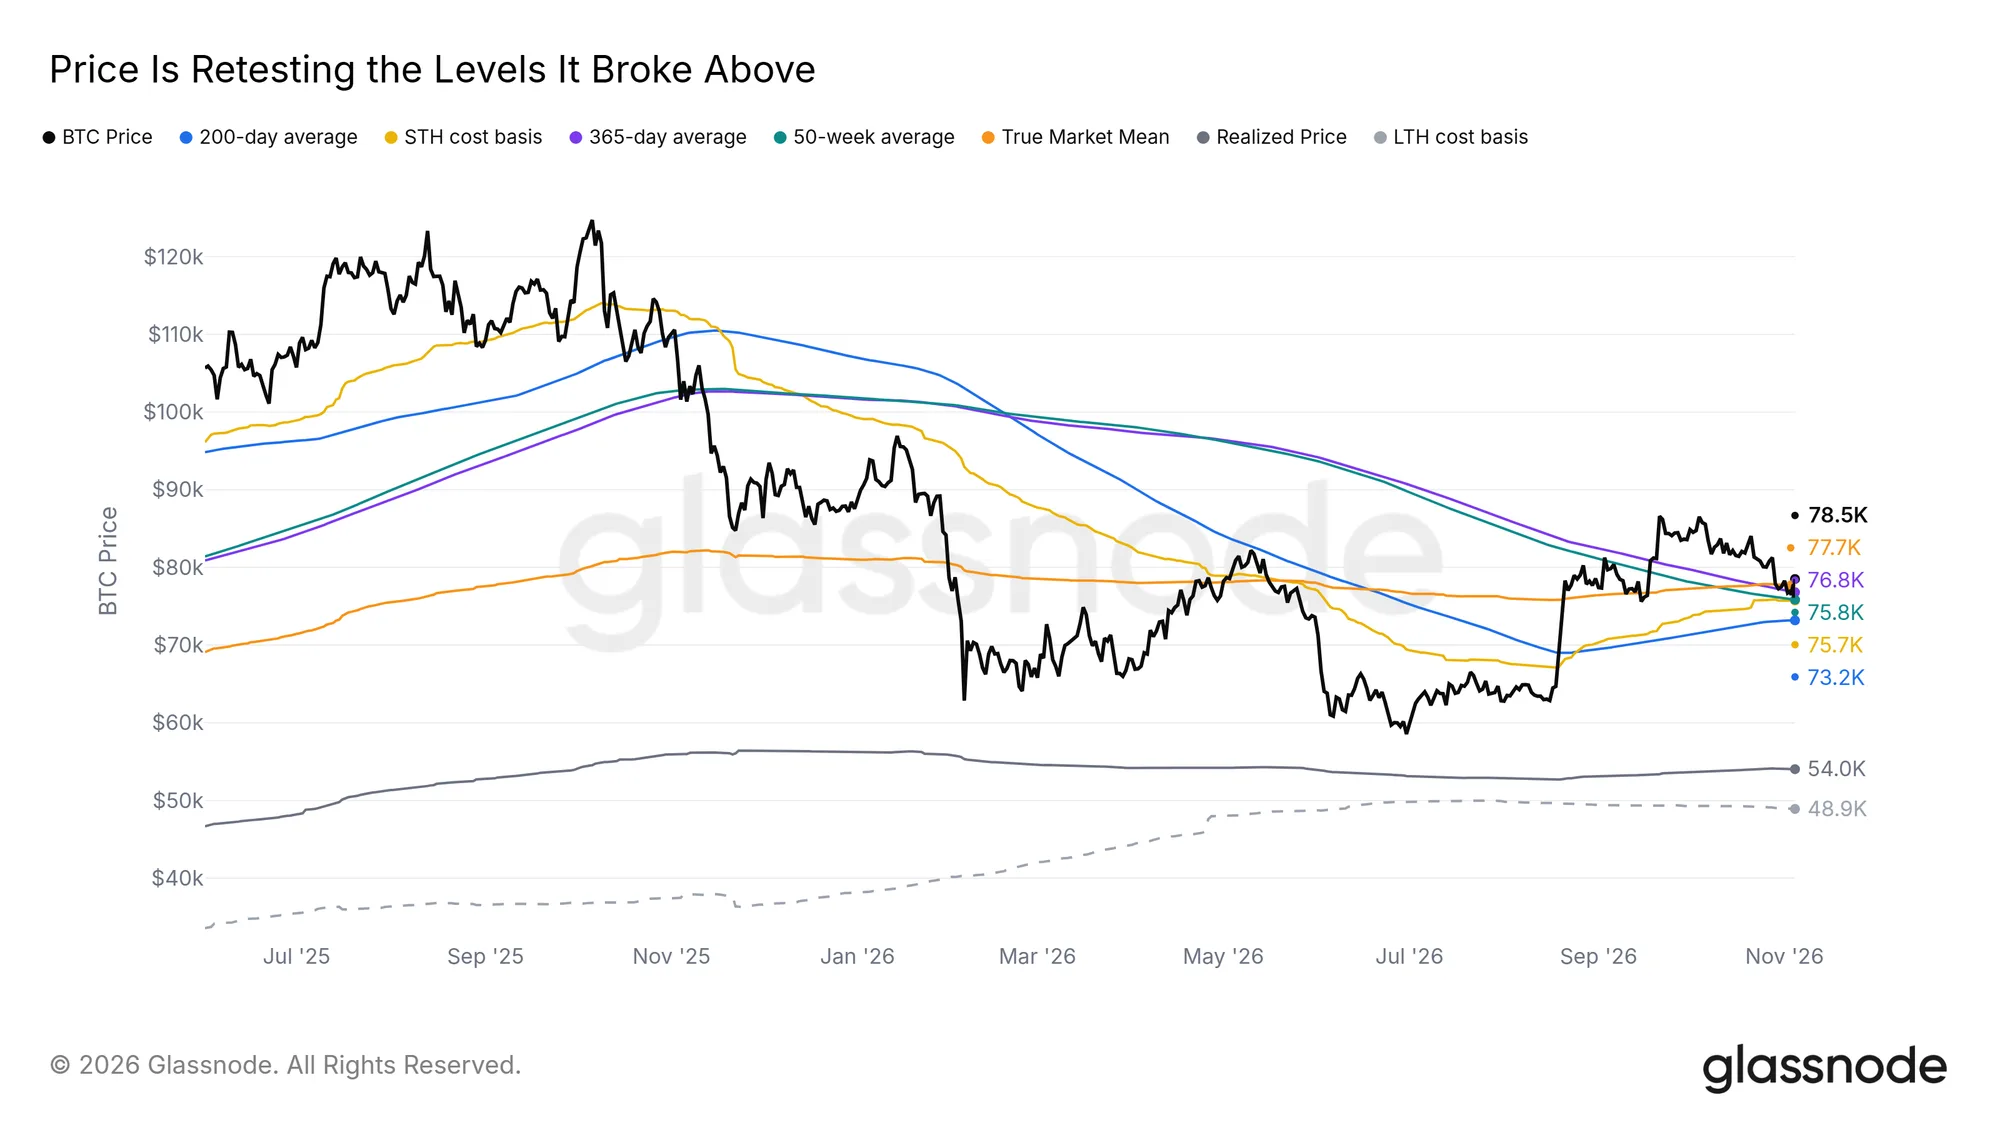
During August and September, Bitcoin recovered several levels lost after the 2025 all-time high, including the 200-day moving average and the Short-Term Holder Cost Basis, the average price paid by newer buyers. It also reclaimed the True Market Mean, which measures the average cost basis of active investors. Glassnode’s previous analysis noted that Bitcoin had stayed above that measure through both October declines.
On November 3, however, Bitcoin closed just below the True Market Mean at $77,700. It slipped to $76,100 overnight before moving back above the measure. Glassnode described such retests as normal after a breakout, with levels reclaimed over several months now being tested as support. The Short-Term Holder Cost Basis at $75,700 and the 50-week moving average sit below; holding above them would preserve the structure established in August.
The report’s liquidation heatmap, which estimates where leveraged futures positions would be forced to close, also showed reduced excess. The decline from the September high crossed many long liquidation levels accumulated since August, lowering the risk of cascading forced selling. Below the market, a remaining band at $73,000–$76,000 overlaps with the Short-Term Holder Cost Basis and the 200-day moving average. A larger cluster at $60,000–$63,000 remains from the August breakout.
Liquidation levels above the market increased over the past week even as Bitcoin fell about 3.5%, suggesting traders added short positions during the decline, Glassnode said. The largest overhead cluster sits near $87,000, close to the September high. A turn higher could force those traders to buy back their positions, potentially reinforcing a move toward that level.
Options positioning points toward year-end upside
The two largest upcoming options expiries, November 27 and December 25, carry $5.7 billion and $12.5 billion in open interest, respectively. Their max pain levels—the prices at which the largest share of open options would expire worthless—are $80,000 and $76,000. With those levels on either side of spot, Glassnode found no clear directional pull from the options market.
Across all expiries, call open interest totals about $18 billion, compared with $13 billion in puts. The largest December call positions are at $80,000, $90,000, $100,000 and $120,000, while puts are concentrated at $60,000 and below as protection against a sharp decline. Glassnode said the distribution suggested positioning for year-end upside. It cautioned that open interest does not identify buyers and sellers: some calls were likely sold by holders seeking premium income, so the total cannot be treated entirely as bullish bets.
Spot and ETF trading volume surged during the August breakout and has since cooled, but remains above its earlier baseline. On a seven-day average, total volume is about 1.5 times its level from mid-July to mid-August and has stayed above that baseline throughout the pullback. Glassnode said volume remained low by ETF-era standards, but sustained activity through a 10% price decline suggested that interest attracted by the August rally had persisted.
Existing capital drives trading as ETFs lose funds
US spot ETFs account for little of that activity. The funds recorded nearly $1 billion in net outflows over the past two weeks, including $640 million on November 2. Daily ETF trading volume has averaged about $1.3 billion since May, roughly a third of its pace in the preceding months.
Glassnode interpreted this as a market driven by capital already within crypto, circulating between assets and venues while little fresh money arrives from traditional investors. It found limited signs of speculative excess or interest from outside crypto. The report also noted that ETF flows have tended to follow price rather than lead it, making the lack of inflows a weaker warning about the next price move than it might appear.
John Kim
John Kim reports on the digital-asset business for TokenPost. Send corrections or tips to info@tokenpost.com.