Cryptocurrency is a curious contrarian financial instrument. Unlike fiat (fiduciary currency), it is not subject to the monetary policy economics of central banks, or the nuances of fiscal policy. The raison d'être for the creation of digital currency like Bitcoin was precisely to operate outside the constraints of the entrenched financial systems and frameworks. By crafting an independent, decentralised, anonymous, and autonomous system of interconnected nodes on a global network, Bitcoin can serve the needs of the global economy in many ways.
BTC USD Trading Activity Punches Through Critical Price Ceilings
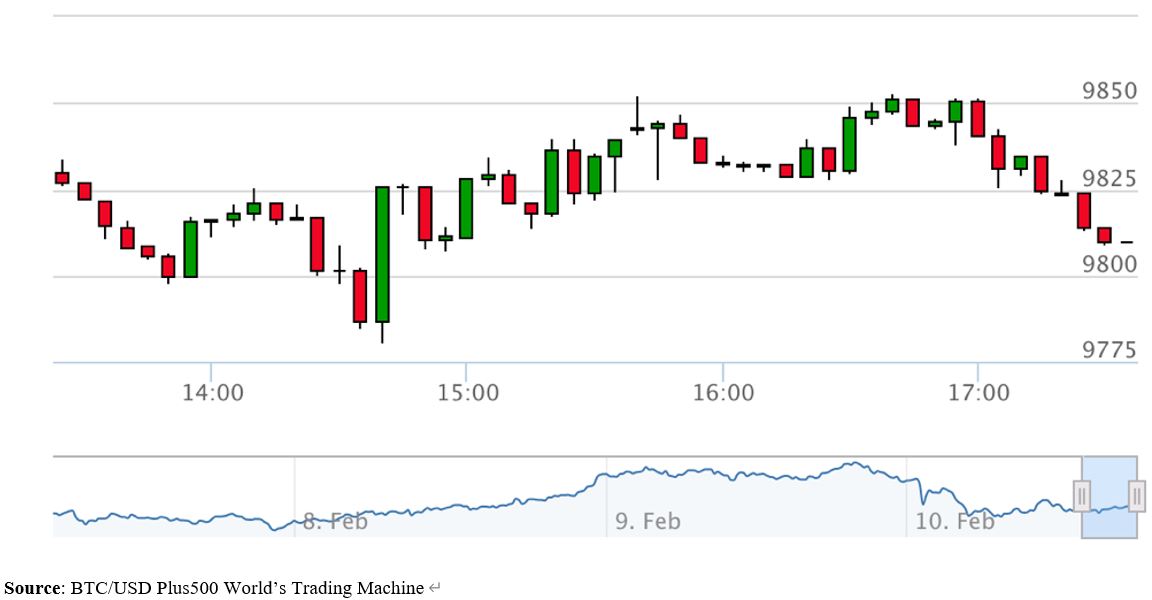
Given that this volatile asset is subject to extreme price fluctuations at any given time, it is difficult to pin down any ‘value’ on Bitcoin at any given time. Technical analysis provides an indication of how prices are moving over time, with candlestick patterns representing bullish or bearish trends, and the opportunity to profit accordingly. In the above chart, it is clear that Bitcoin approached a price of $9850, as a price ceiling. On the lower end, the price support floor hovered around $9775. All the trading activity in between these high and low points during the period in question (February 2020) is reflective of the variance around the mean.
Current Trends in BTC USD Pricing
Technical analysis of Bitcoin can lead to some interesting observations of this digital currency. For example, the current spread is hovering around $36. If we assume a price of approximately $10,000, that represents a spread percentage of 0.37%. Current sentiment reflects that Bitcoin’s price is bearish, as evidenced by the successive red candlesticks on the far right of the chart. Short-term declines in price are indicative of excess Sell orders of BTC. However, this does not tell the full story.
Price drops could be the result of multiple factors, notably profit taking, major announcements, speculative actions with Bitcoin futures on the CME, a tightening of regulatory frameworks and greater transparency, et cetera. By and large, the reasons behind wild price swings in Bitcoin are typically attributed to speculative actions. When speculators are excited about digital currency, Bitcoin’s price rises. When they feel scared, they dump the cryptocurrency en masse and prices drop. This recent upward shift in Bitcoin prices is much more strategic in nature, and not the result of nebulous assumptions.
Trading of BTC USD Strongly Bullish
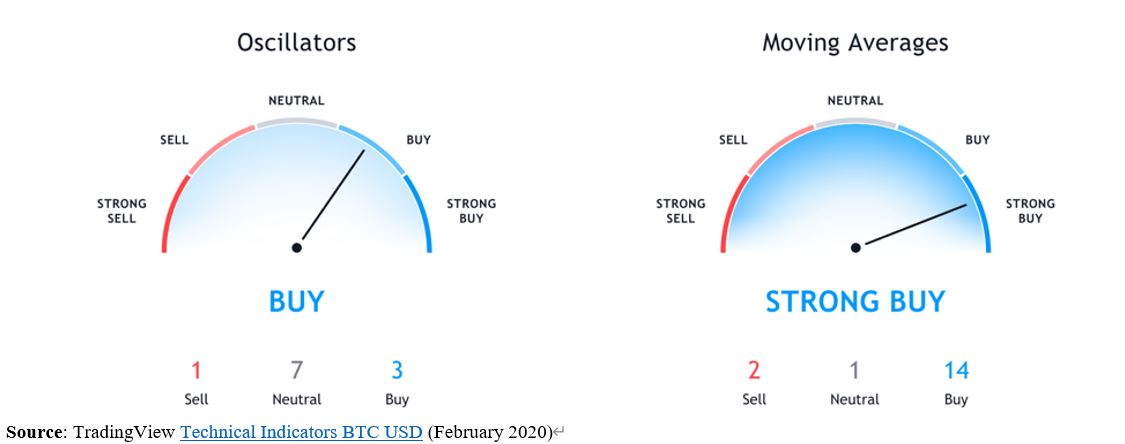
Current market indicators reveal that Bitcoin is net bullish by a long margin. Traders at regulated brokers are actively buying/selling BTC USD CFDs (Contracts for Difference) with a strong emphasis on bullish actions. These derivatives trading products give traders the option to profit off rising and falling prices. With Bitcoin CFDs, traders speculate on cryptocurrency prices with put options for bearish forecasts and call options on bullish forecasts. The technical indicators for BTC USD reflect a dominant buy rating heading into the latter half of February 2020. These include the oscillators and the moving averages.
For example, the Awesome Oscillator, Momentum (10) Oscillator, and Moving Average Convergence Divergences Level (12, 26) are all buy options. With the moving averages, the current technical analysis points to strong buy sentiment. For example, EMA's and SMA's (Exponential Moving Averages and Simple Moving Averages) are remarkably bullish. This is true for short-term (5 and 10-day MAs) as well as longer-term (20, 30, 50, 100, and 200-day MAs).
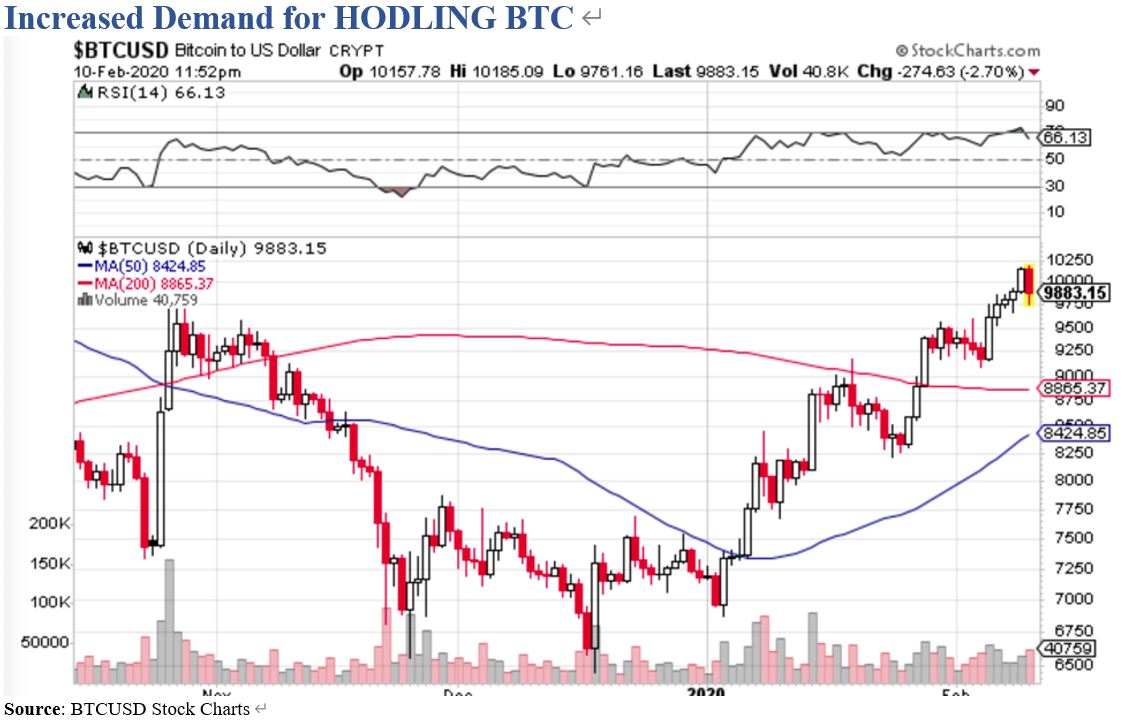
Just recently, Yahoo! Finance reported that Bitcoin temporarily broke through the critical $10,000 resistance level. This important psychological level has remained elusive for quite some time. However, trading volumes finally reached critical mass and pushed BTC over that line. In recent weeks, BTC's movements have been strongly bullish, with 50-day EMAs crossing over the 200-day EMA for the first time in 10 months. In May 2020, the reward for mining Bitcoin will halve, helping to drive the current rally to its short-term bullish levels. Now that Bitcoin rewards are imminently close to 6.25 per block mined, as opposed to 12.5, there will be greater demand for BTC HODLs.
This latest rally, pyrrhic though it may be, has inspired renewed confidence and optimism in BTC.


