XRP/USD chart - Trading View
Exchange - Kraken
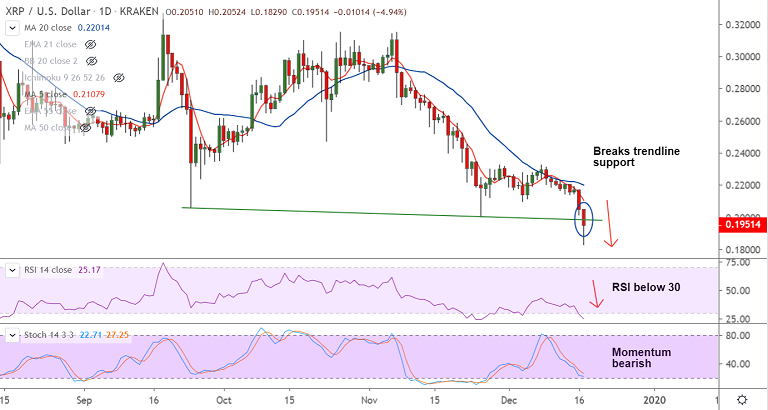
Support: 0.1800 (Nov 2017 low); Resistance: 0.2105 (5-DMA)
Technical Analysis: Bias Bearish
Ripple (XRP) extends previous session's slump, hits lows unseen since Nov 2017, bias strongly bearish.
XRP/USD was trading 0.1949 at around 09:00 GMT, slightly higher from session lows at 0.1829.
The pair is set to extend weakness with technical indicators strongly supporting downside.
That said, oscillators are at oversold levels and price action has edged outside the lower Bollinger band.
Minor consolidation, if not upticks possible before the next leg lower. Near-term upside only above 21-EMA (currently at 0.2218).
Little support seen on the downside. Next major bear targets lie at 0.1800 (Nov 2017 low) ahead at 0.1500 (Sept 2017 low).


