LTC/USD chart - Trading View
Exchange - Coinbase
Technical Analysis: Bias Bullish
GMMA Indicator: Major Trend - Bullish; Minor Trend - Bullish
Overbought/ Oversold Index: Neutral
Volatility: Shrinking
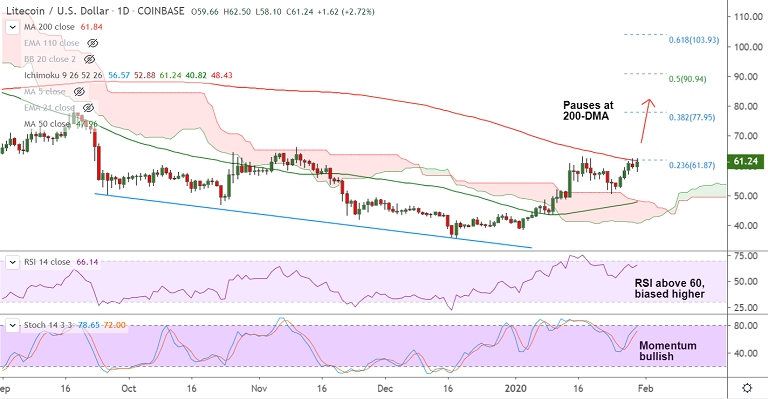
Support: 59.22 (5-DMA); Resistance: 61.84 (200-DMA)
LTC/USD has erased early losses and has retraced above 5-DMA, bias remains bullish.
The pair was trading 2.99% higher at 61.40 at around 09:30 GMT, after closing 1.65% lower in the previous session.
Price action is capped at 200-DMA which is offering stiff resistance at 61.84. Break above will fuel further gains.
Technical indicators are biased higher, 2-hourly charts confirms a 'Golden Cross' on the hourly charts.
RSI is above 60 and biased higher and momentum studies are bullish, MACD is well in the positive territory.
Decisive breakout at 200-DMA will see gains till 38.2% Fib at 77.95. 110-EMA is strong support at 53.89. Weakness likely on break below.


