ETH/USD chart - Trading View
Exchange - Coinbase
Technical Analysis: Bullish
GMMA Indicator: Major Trend - Bullish; Minor Trend - Bullish
Overbought/ Oversold Index: Highly overbought
Volatility: High and rising
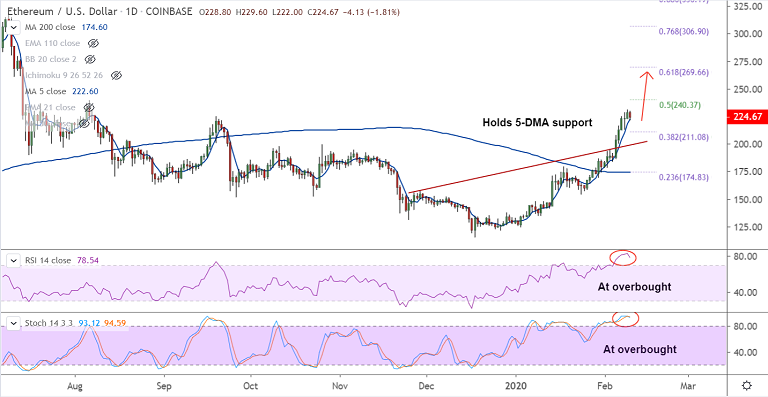
Support: 222.72 (5-DMA); Resistance: 40.37 (50% Fib)
ETH/USD trades 1.85% lower at 224.47 at around 05:40 GMT, after closing 2.43% higher in the previous session.
The pair has paused its bullish streak and overbought oscillators raise scope for further weakness.
Price action is holding support at 5-DMA at 222.44. Break below to see more downside.
Further, bearish divergence on RSI and Stochastics on the hourly charts adds to the bearish pressure.
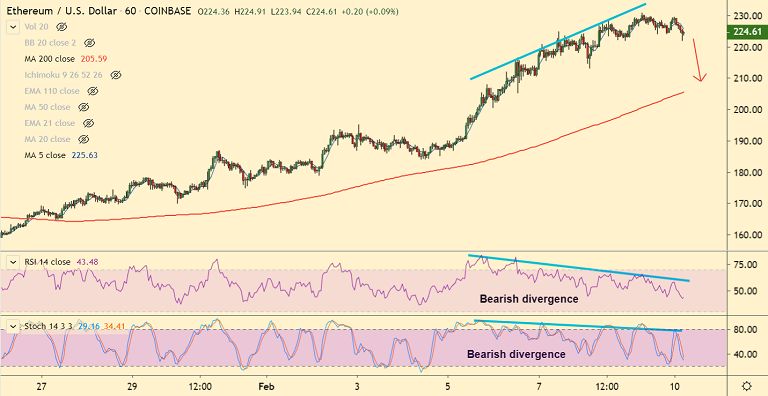
Break below 5-DMA could see dip till 200H MA at 205.58. Breach at 200H MA finds next major support at 21-EMA at 193.20.
Major and minor trend remains bullish. Resumption of upside will see test of 61.8% Fib at 269.66.


