ETH/USD chart - Trading View
Exchange - Coinbase
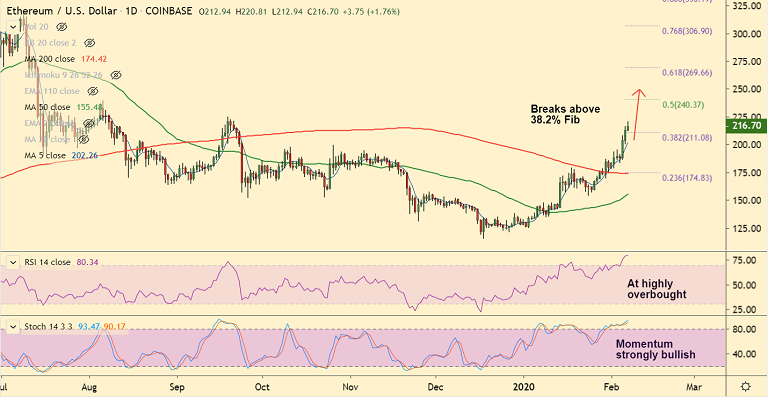
Technical Analysis: Bias Bullish
Support: 211.08 (38.2% Fib); Resistance: 222.55 (Weekly cloud base)
ETH/USD continues to march higher as bulls retain control, bias strongly bullish.
The pair was trading 2.01% higher on the day at 217.19 at around 04:05 GMT, after closing 4.39% higher in the previous session.
Corrections in the pair have held above 200H MA and price action has broken above 38.2% Fib retracement at 211.08.
Major and minor trend as evidenced by the GMMA indicator are bullish, technical indicators are strongly biased higher.
That said, there are chances for minor corrections as oscillators are in highly overbought territory.
55W EMA at 222.55 is stiff resistance for the pair. Break above will see little resistance till 269.66 (61.8% Fib).
On the flipside, 200H MA at 189.37 is strong support, break below could change near-term dynamics.


