BTC/USD chart - Trading View
Exchange - Coinbase
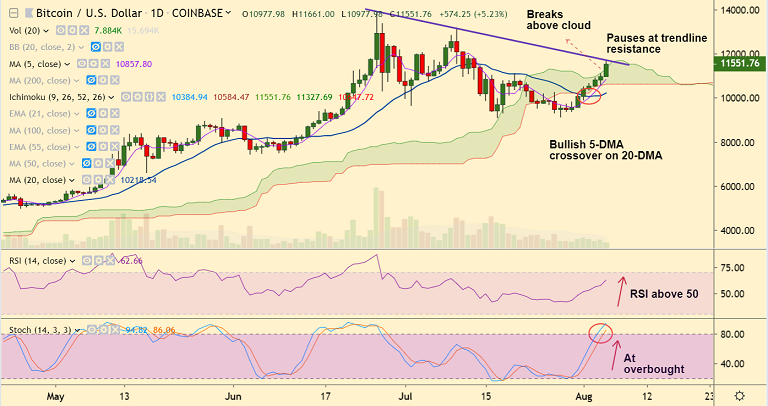
Support: 10,858 (5-DMA); Resistance: 11,690 (trendline resistance)
Technical Analysis: Bias Bullish
Bitcoin rallies above $11,000 mark, hits 4-week highs at 11,661.
BTC/USD was trading over 5% higher on the day at 11,536 at 05:10 GMT.
The pair has started the week on a bullish note, price action has broken above daily cloud.
Momentum with the bulls, but Stochastics oscillator has approached overbought levels, so caution advised.
MACD shows a bullish crossover on signal line and DMI support gains. Volatility is rising as indicated by widening Bollinger bands.
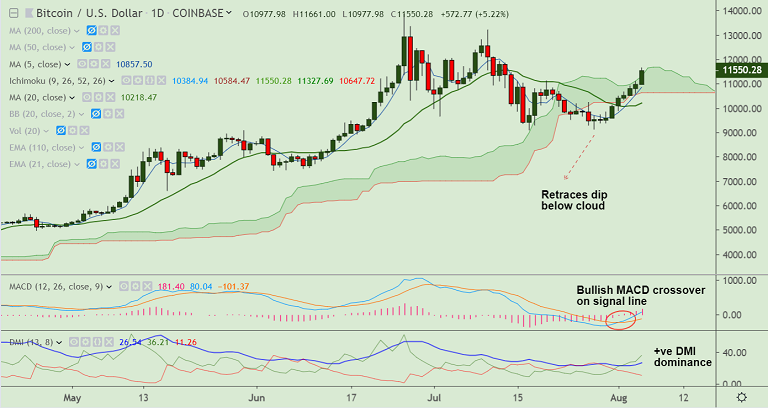
Bullish 5-DMA crossover on 20-DMA and positive DMI dominance add to the upside bias.
The pair has paused at strong trendline resistance at 11,690, break above will see resumption of upside.
Next immediate resistance lies at 61.8% Fib at 12,035 ahead of upper Bollinger band (weekly) at 13,115.
Immediate support lies at 10,859 (5-DMA). Break below cloud will see dip till 20-DMA at 10218.


