BTC/USD chart - Trading View
Exchange - Coinbase
Technical Analysis (Daily): Near-Term Bullish
GMMA Indicator: Major Trend - Bearish; Minor Trend - Bullish
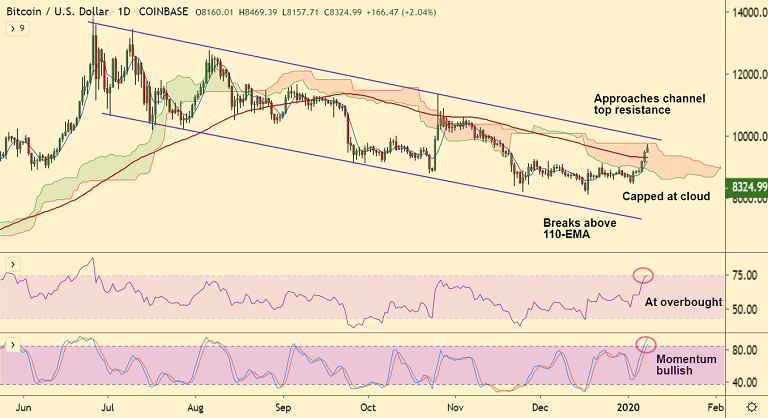
Overbought/ Oversold Index: Overbought
Support: 8013 (110-EMA); Resistance: 8533 (cloud top)
Major Candlestick Patterns: Potential Three White Soldiers (Daily)
BTC/USD has edged lower from session highs at 8469.39 and was trading 1.90% higher at 8311 at around 04:30 GMT. The pair is on track to form a bullish 3 White Soldiers pattern which if successfully completed will buoy prices higher.
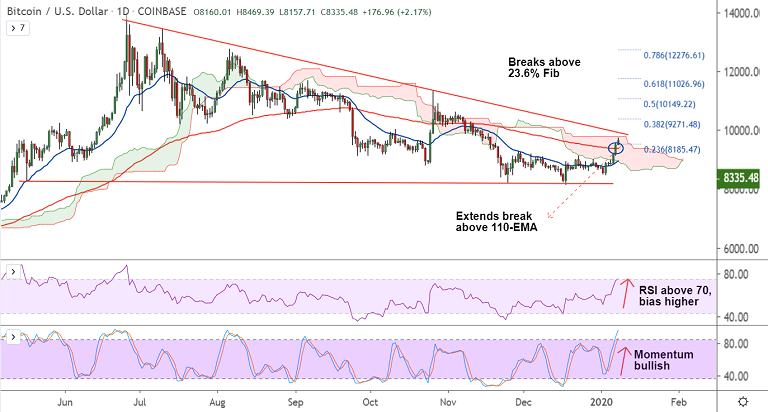
Price action has shown a breaks above 23.6% Fib retracement of 13868.44 (June 26 High) to 6430 (Dec 18 Low) at 8185. The pair is extending break above 110-EMA which has now turned immediate support at 8013.
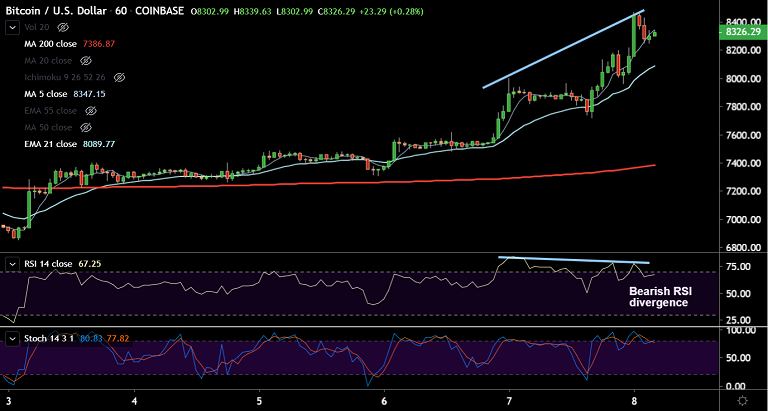
Price action is above the upper Bollinger Band. On the intraday charts, a bearish RSI divergence on hourly charts raises scope for minor pull backs. Adding to the downside pressure are overbought oscillators which could limit upside and force sideways trade.
The pair has approached stiff resistance zone 8530-8750. Price action continues in sloping channel pattern and decisive breakout at channel top will see fresh upside momentum. Gains till 61.8% Fib at 11026 cannot be ruled out if the pair manages to break 200-DMA resistance at 9206.
Immediate support is seen at 8013 (110-EMA). Retrace below will see dip till 55-EMA at 7600. Breach at 55-EMA support negates near-term bullish bias.


